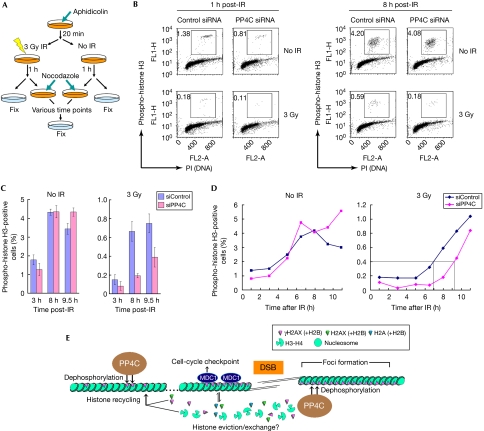
Figure 4.
PP4 promotes recovery from the G2/M checkpoint arrest. (A) Schematic diagram of the checkpoint recovery experiment. S-phase cells were first arrested by incubation with aphidicolin, then mock-treated (No IR) or irradiated with an X-ray dose of 3 Gy. At 1 h post-treatment, nocodazole was added to the media and cells were fixed at various time points for processing by flow cytometry. (B) U2OS cells transfected with siRNAs against PP4C or a non-targeting control sequence were collected 1 and 8 h after mock (No IR) or 3 Gy irradiation and processed for flow cytometry with an antibody against phospho-histone H3 and propidium iodide (PI). The boxes represent the mitotic cells. (C) U2OS cells transfected with siRNAs against PP4C or a non-targeting control sequence were mock-treated (No IR) or irradiated (3Gy), and processed as described in (A). The percentage of mitotic cells (as determined by phospho-histone H3 staining) was calculated for each indicated time point. The experiment was repeated three times and the error bars represent the standard deviation. (D) Percentage of mitotic cells (as determined by phospho-histone H3 staining) calculated for each time point for the mock-irradiated (No IR, left) or irradiated (3 Gy, right) samples. The onset of mitosis represented by the intersecting lines was arbitrarily fixed at 0.4%. (E) Model of action of PP4 and dephosphorylation of γH2AX. IR, irradiation; siRNA, small interfering RNA.

