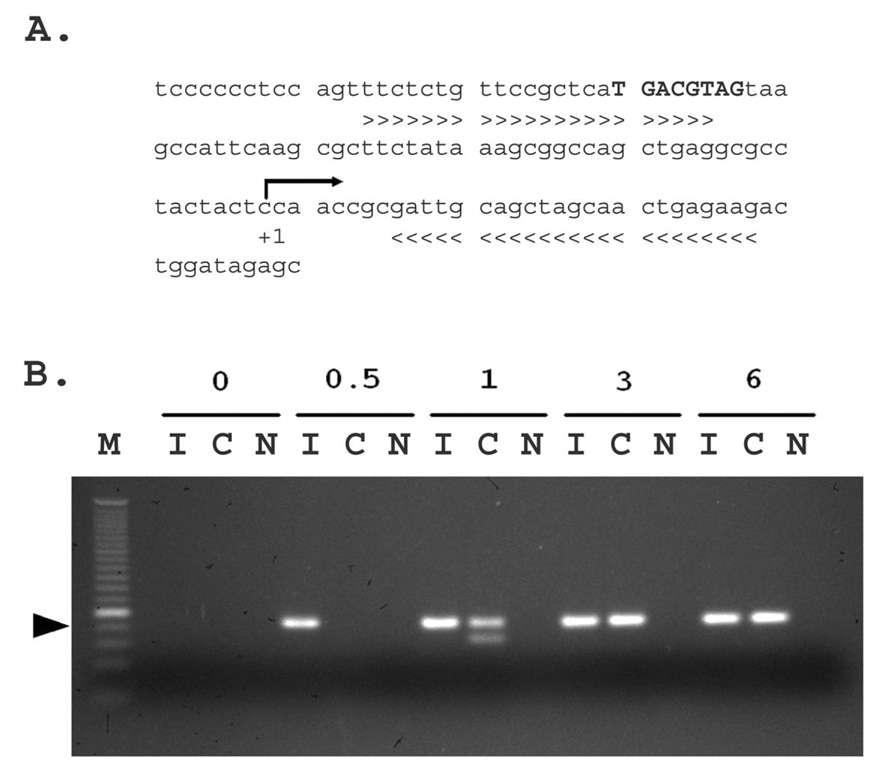
Figure 1. The c-fos gene promoter was enriched by pCREB immunoprecipitaion in microdissected rat cortical samples.
A. The partial rat c-fos gene promoter sequences (from accession #: AY786174) showing the locations of cAMP response element (CRE) site and PCR primers used for detecting enrichment of the promoter. +1 and the arrow indicate the transcription start site and transcription direction. Capital letters in bold denote the CREB binding site (from −58 to −51 bp). The > and < symbols underneath the sequences indicate the sequences of forward (>) and reverse (<) PCR primers used. The PCR amplicon size is 104 bp. B. PCR amplification of c-fos gene promoter sequences from Fast CChIP DNA obtained from different numbers of tissue micropunches. PCR product was visualized on a 3% agarose gel. One 30th Input DNA and one 20th of ChIP DNA were used as template for first round PCR reaction in a 25 µl volume for 15 cycles. Then 2 µl of each PCR product was used for a second round of amplification in a 25 µl volume and for 40 cycles. M: 25 bp DNA ladder (Invitrogen). Black arrow head indicates the 100 bp fragment. Numbers 0, 0.5, 1, 3, and 6 on top of the gel indicates the number of 0.2 mm3 micropunch tissues used as starting material. I: input chromatin; C: anti-pCREB IP; N: normal IgG IP.

