
Figure 2.
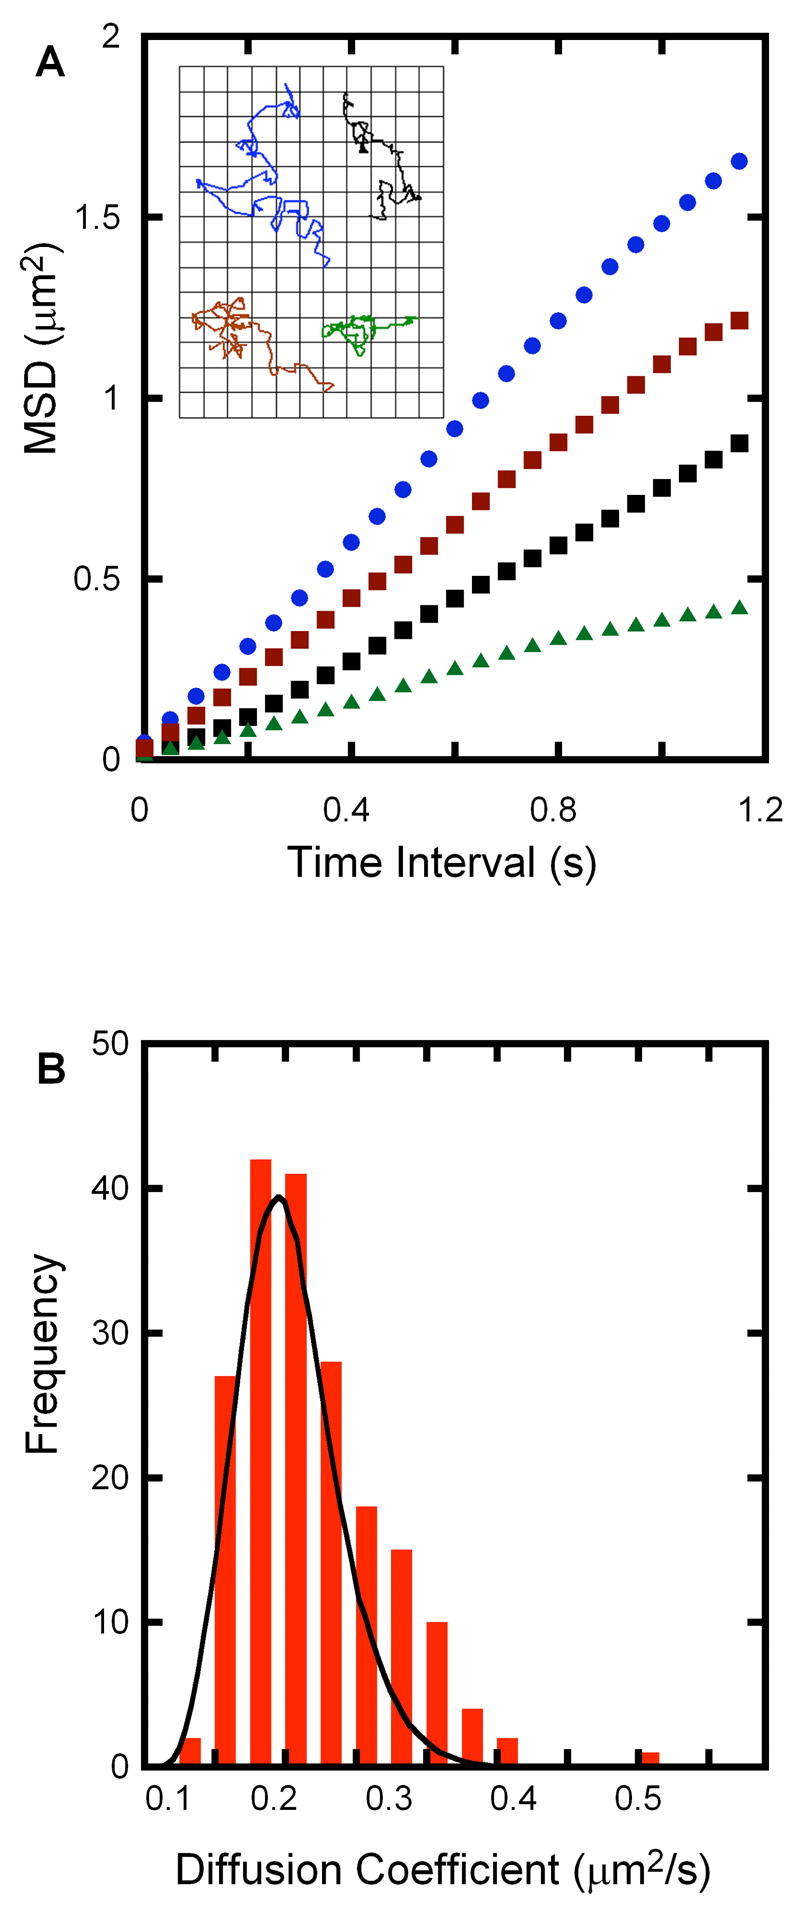
(A) The mean square displacement versus time plots of the four example trajectories in the inset showing a linear relationship as expected from a random walk trajectory. The diffusion coefficients are 0.37 μm2/s (blue), 0.27 μm2/s (red), 0.19 μm2/s (black) and 0.10 μm2/s (green). Grid in the inset is 0.5 μm × 0.5 μm and the total time interval is 3.6 s. (B) Histogram plot of 190 independent vesicle diffusion coefficients with an average value of 0.2 μm2/s. The black curve is the statistically predicted width of the distribution for this average value (Eq. 3).