
Figure 3.
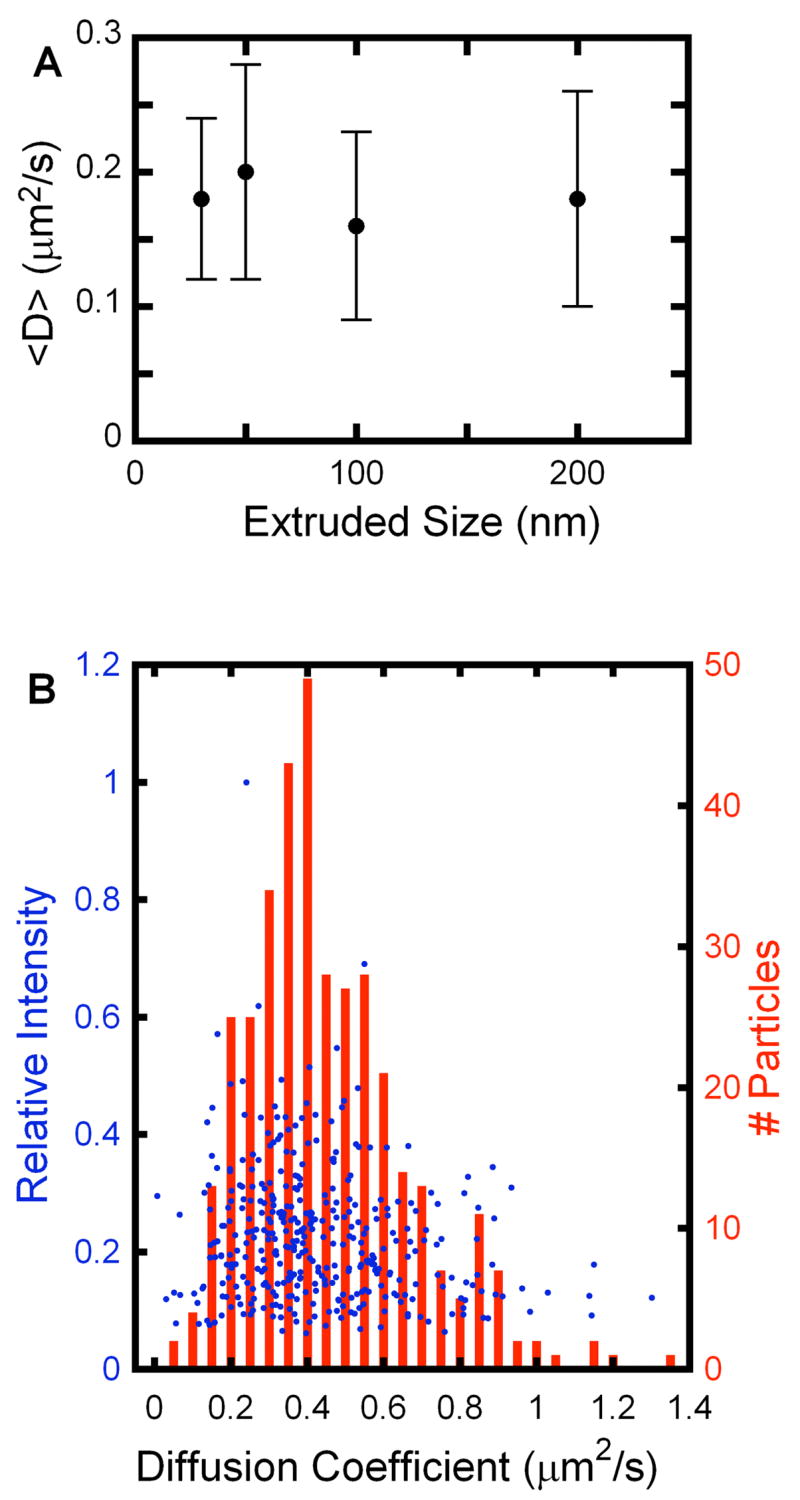
(A) Measured average diffusion coefficients of tethered vesicles as a function of extruded size between 30 and 200 nm. In this range, no dependence of size on D was observed. (B) Vesicles extruded through 100 nm polycarbonate membranes were tethered and diffusion coefficients were measured with a distribution shown in the histogram in red. The intensity variation of the individual vesicles under epi-fluorescence microscopy reflects the intrinsic size distribution of extruded vesicles. Relative integrated intensities for each vesicle were plotted against their diffusion coefficients (blue). No correlation between intensity and diffusion coefficient was observed, consistent with the observation in (A).