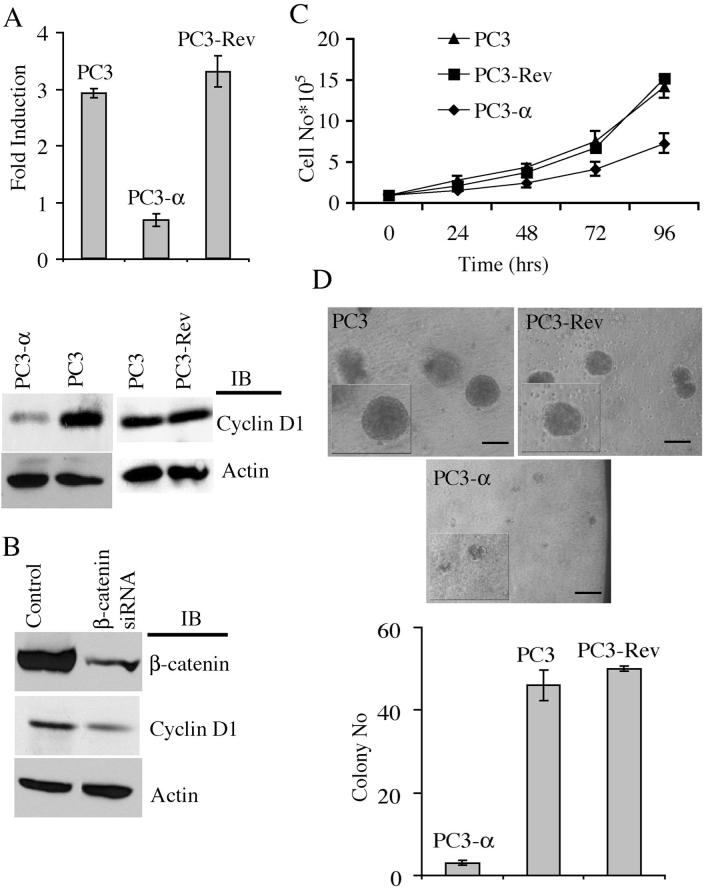
Figure 3. α-Catenin expression decreases β-catenin/TCF/LEF transcription activity and cell proliferation.
A, Top panel: β-catenin/TCF/LEF luciferase reporter assay. Fold induction corresponds to luciferase activity of positive TOPFLASH reporter over negative FOPFLASH reporter. Bars represent standard error of the average of three independent experiments. Bottom panel: Immunoblot of cyclin D1 in PC3, PC3-Rev, and PC3-α cells. B, Immunoblot of β-catenin and cyclin D1 upon siRNA knockdown of β-catenin in PC3 cells and in PC3 cells transfected with control siRNA. Actin was used as a loading control. Representative blot from two independent experiments is shown. C, Growth curve of PC3, PC3-Rev, and PC3-α cells. Bars represent standard error. Experiment was done in triplicate and repeated once. D, Top panel: Matrigel spheroid formation of PC3, PC3-Rev, and PC3-α cells. Inset shows cysts at a higher magnification. Bar represents 1 mm. Bottom panel: Quantification of PC3, PC3-Rev and PC3-α matrigel spheroids. Bar represents the standard error of the means of three independent experiments.

