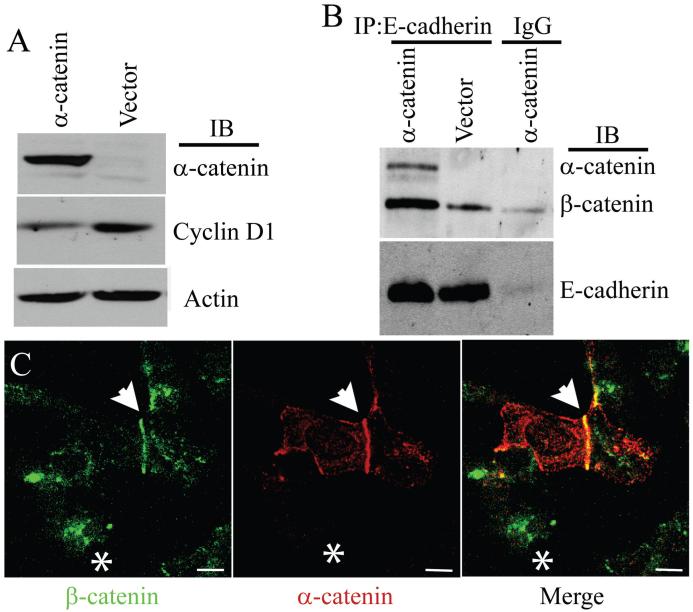
Figure 4. Exogenous expression of α-catenin reduces nuclear β-catenin levels.
A, Immunblot analysis of cyclin D1 levels in α-catenin expressing PC3 cells. Actin was used as a loading control. Blot represents two independent experiments. B, Co-immunoprecipitation of α-catenin and β-catenin with E-cadherin. The blots were probed with anti α- and β-catenin antibodies simultaneously. Blot represents three independent experiments. C, Immunofluorescence staining of β-catenin (green) and α-catenin (red) in PC3 cells transiently expressing α-catenin. Arrow highlights co-localization of β-catenin and α-catenin at the site of cell-cell contact in α-catenin expressing PC3 cells. Asterisk marks untransfected PC3 cell with nuclear and cytoplasmic staining of β-catenin. Bar represents 15 μm.

