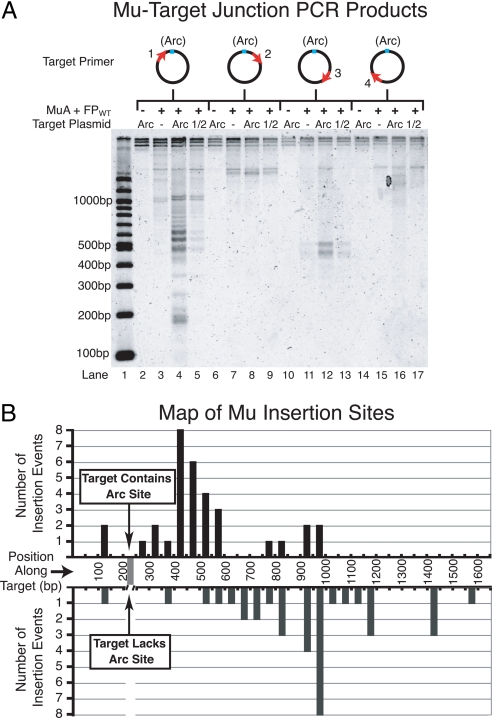
Fig. 5.
Maps of intermolecular transposition events. (A) Agarose gel of PCR amplified donor–target joints from in vitro transposition reactions containing FPWT·ADP and either pCS14 (non-Arc), pCS15 (Arc), or pCS16 (1/2 Arc) target plasmids. Diagrams above the gel indicate the position of the target primer relative to the Arc operator. Note that the samples contained different amounts of total DNA because transposition was more efficient into plasmids containing a copy of the Arc operator, and therefore, these samples contained a much larger number of donor–target joint molecules that could be amplified during PCR. This discrepancy is apparent upon inspecting the total signal per lane for Arc operator vs. non-Arc operator samples. However, because we do not expect a change in the concentration of donor–target DNA joints to cause a large PCR bias, it is informative to compare the relative intensities of bands within one lane to those within another lane. (B) Graph representing the frequency of transposition events at positions along the target DNA based on the recovery of cloned Mu–target junctions. We mapped a total of 33 events into pCS15 (Arc target) and 35 events into pCS14 (non-Arc target) from reactions containing FPWT·ADP. Individually mapped events were binned into 50-bp intervals. Donor–target joints were PCR-amplified by using primer 1 (see A).

