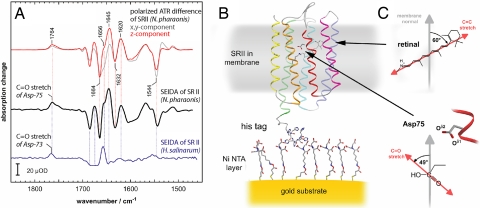
Fig. 2.
SEIDA spectroscopy on a membrane protein. (A) Light-induced SEIDA spectra of sensory rhodopsin II from N. p. (black trace) and from H. s. (blue trace) reflect the transition from the resting dark state (negative bands) to the photoactivated state (positive bands). The z-component of the difference spectrum of N. p. SR II as determined by conventional ATR spectroscopy under polarized conditions (red trace), demonstrates that SEIDA selectively probes vibrations with dipole vectors parallel to the membrane normal. For comparison, the x,y component is also shown (gray trace), which corresponds to the in-plane orientation. (B) Structural model of sensory rhodopsin II bound via the C-terminal His-tag to the Ni-NTA modified gold surface (24). (C) Magnified structure and spatial orientation of the cofactor retinal and of the side chain of the proton acceptor D75 versus the membrane normal.

