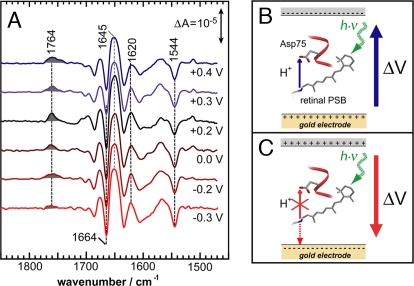
Fig. 3.
SEIDA spectra at various transmembrane voltages across the membrane protein monolayer. (A) IR difference spectra of sensory rhodopsin II from N. p. were recorded at potentials from +0.4 V to −0.3 V (from top to bottom). Applied voltages are given versus the normal hydrogen electrode. (B) Sketch of the light-induced (green broken arrow) proton transfer reaction (thin blue arrow) from the donating retinal Schiff base of sensory rhodopsin II to the accepting carboxylic side chain of D75. The proton transfer step occurs in the same direction as the electric field vector (thick blue arrow that indicates the transmembrane voltage ΔV between the working gold electrode (+) and the counter electrode (−). (C) Protonation of D75 ceases (crossed out red upward arrow) when ΔV is opposite (bold red arrow) and lower than −0.2 V. In this case, the Schiff base proton is driven by the negative voltage toward the cytoplasmic side (red downward arrow).

