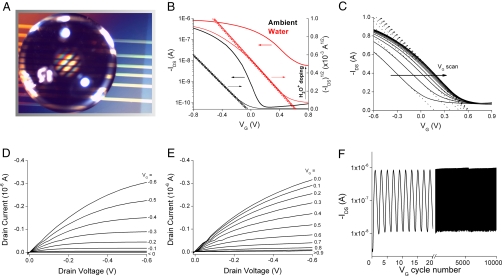
Fig. 3.
DDFTTF OTFT operation in aqueous media. (A) Optical micrograph of an OTFT with DDFTTF and 22-nm PVP-HDA under aqueous conditions. (B) Transfer characteristics (VDS = −0.6 V) in ambient (black) and water (red). The right axis shows the semilog plot of IDS vs. VG and the left axis shows IDS1/2 vs. VG. (C) Transfer characteristics recorded sequentially after the addition of water. (D) Output characteristics (IDS vs. VDS) in ambient. (E) Output characteristics under water. (F) IDS vs. VG (0.3 to −1 V) at a VDS = −0.6 V measured over 104 cycles (over a period of 12 h) with the initial 20 cycles expanded.

