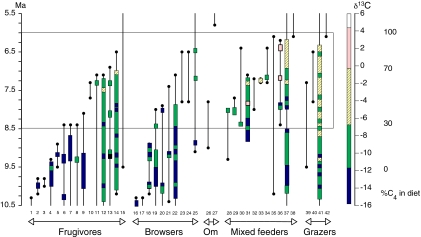
Fig. 3.
Biostratigraphic ranges of 42 herbivorous lineages (at the species level except for hipparionine equids) from the late Miocene analysis interval. Isotopic sampling is indicated by colored vertical bars; if a sampling gap of >0.5 Ma is present, the lineage is represented by multiple bars rather than a continuous bar. Table S2 provides the lineages and age ranges that are the basis for the biostratigraphy.

