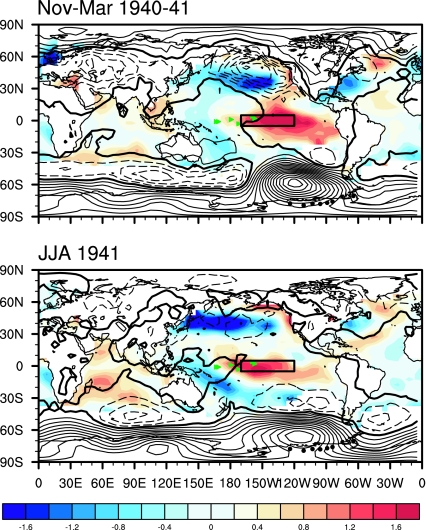
Fig. 2.
Maps showing SST anomalies in °C (color scale) and SLP anomalies (contours every 1 hPA, positive anomalies solid lines and negative anomalies as dashed lines) for the peak of the El Niño event in 1940–41. The black dots in West Antarctica indicate the ice core sites. The sites of the rainfall observations are indicated with green triangles, and the Niño3.4 region is outlined by the rectangle. The SST data are from the Kaplan dataset (20). The SLP data are from the Hadley SLP2 dataset (19). Both datasets were obtained from the Earth System Research Laboratory of the National Oceanic and Atmospheric Administration.

