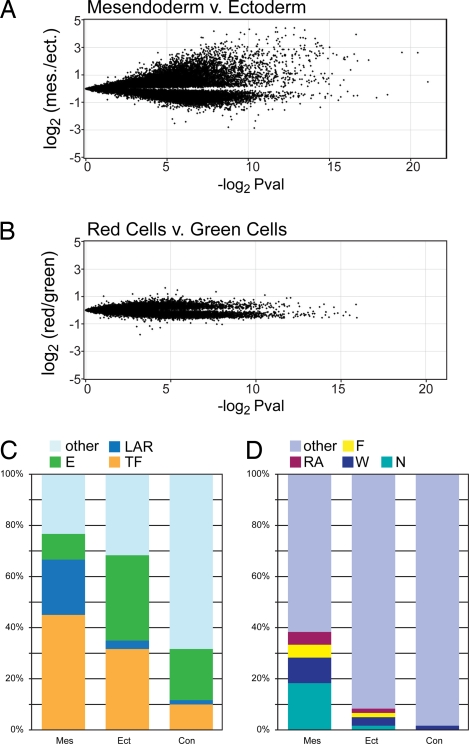
Fig. 2.
Transcriptome analysis of mesendoderm and neurectoderm precursor cells. (A and B) Volcano plots showing 31,356 (A) and 25,837 (B) oligos each. Each oligo is mapped along the y axis according to its relative enrichment in a direct comparison of the two source tissues (average normalized Log2 of the hybridization signal ratio) and along the x axis according to its significance (negative Log2 scale of uncorrected P value). (A) FAM-P isolated mesendoderm precursor cells (> 0 on Y axis) vs. cognate FAM-P isolated ectoderm precursor cells (< 0 on Y axis). (B) Kaede-injected and photoconverted embryo cells (> 0 on Y axis) vs. cells from Kaede-injected embryos that were not photoconverted (< 0 on Y axis). (C and D) Bar graphs showing the representation of selected molecular functions (C) and signaling pathways (D) among the 60 most-enriched genes (Table S2). Mes, mesendoderm precursor enriched; Ect, ectoderm precursor enriched; Con, red control cell enriched; E, Enzyme; LAR, ligand (agonist), antagonistic ligand or receptor; TF, transcription factor; N, Nodal pathway; W, Wnt pathway; F, FGF pathway; RA, retinoic acid pathway. Genes acting in multiple pathways were arbitrarily assigned to one pathway with the following priority: RA > F > W > N.

