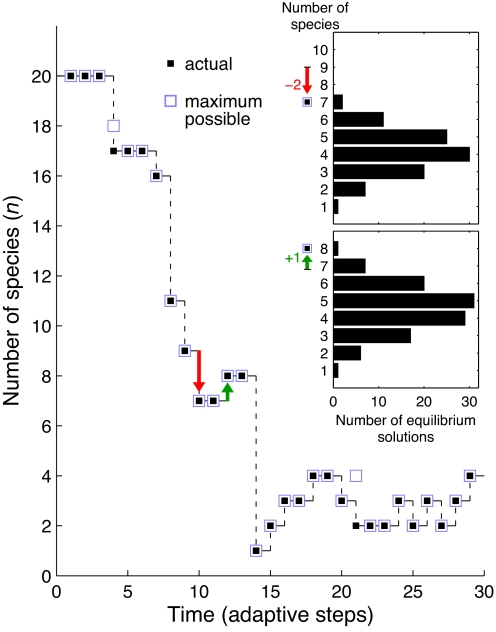
Fig. 3.
Decline in community size is determined by properties of the evolved species rather than by constraints on the ecological dynamics. Shown is the number of species as a function of time in a typical evolutionary run with k = 20 resources. The actual number of species obtained in the simulation following each adaptive step (black squares) almost always equals the size of the largest possible subset of species at that step that includes the new beneficial mutant, and that can coexist in equilibrium (blue squares). Only two cases are seen in this example in which the actual number of species reached is smaller than the maximal possible (empty blue squares at t = 4 and t = 21). (Inset) Distributions of number of species within all of the species subsets that include the new mutant lineage and allow ecological equilibrium at two representative adaptive steps of extinction and speciation (down-pointing red arrows and up-pointing green arrows). The maximum of each distribution, corresponding to the largest possible stable species consortium, is indicated by the blue squares. The arrows indicate the actual change in the number of species at these two steps.

