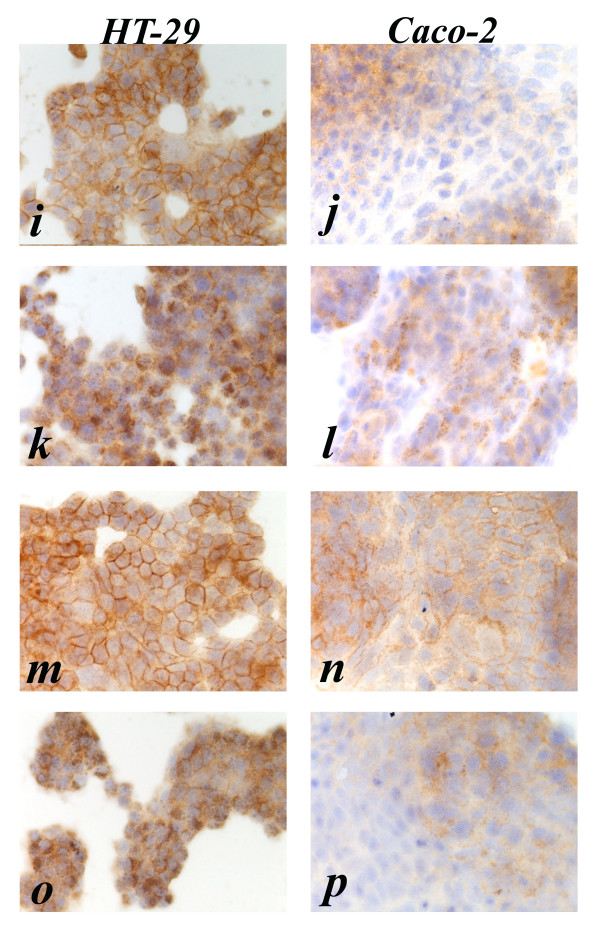
Figure 3.
Anti-EGFR immunostaining pattern in HT-29 and Caco-2 cell lines, respectively. i, j (10 nmol/L cetuximab treated); k, l (10 nmol/L cetuximab plus 10 nM EGF treated); m, n (1 μmol/L gefitinib treated); o, p (1 μmol/L gefitinib plus 10 nM EGF treated). HT-29. Continuous moderate to strong membrane staining is present in untreated and cetuximab or gefitinib treated cells. Strong granular cytoplasmic immunostaining was present for all treatments plus EGF, without any observable membrane staining. Caco-2. Continuous weak to moderate membrane brown staining is present in untreated as well as in cetuximab 5 nmol/L and gefitinib 1 μmol/L treated cells. Weak membrane immunostaining was present in cetuximab 10 nmol/L treated cells. The cytoplasmic immunostaining pattern was granular in EGF 10 nM, diffuse in gefitinib 1 μmol/L plus EGF 10 nM and a mixture of the two (granular and diffuse) in cetuximab 5 and 10 nmol/L plus EGF 10 nM treated cells.

