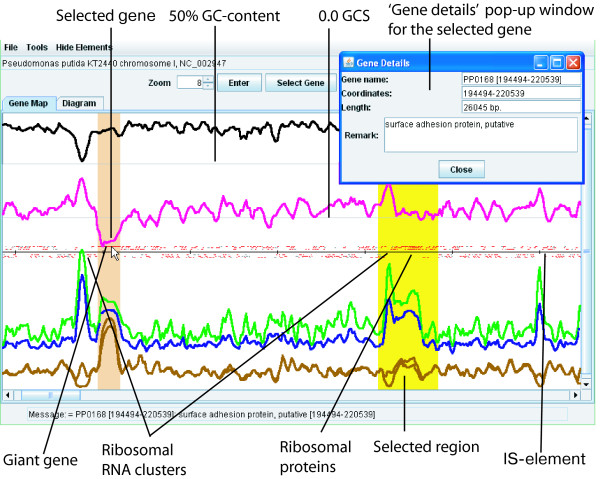
Figure 2.
Identification of divergent genomic regions on the 'Gene Map' view. Superimposition of different OU parameters such as GC (black line), GCS (pink), PS (green), D (blue), GRV (upper brown line) and RV (lower brown line) allows discrimination of divergent genomic regions. In this example a part of the chromosome of Pseudomonas putida KT2440 (127–774 kbp) is displayed in the applet window. A genomic fragment was highlighted using the function 'Select region' and a giant gene, PP0168, was selected by 'Select gene'. A pop-up window 'Gene Details' was opened by double-clicking the gene on the map. Genes are indicated by red and grey (for hypotheticals) bars. The black horizontal line separates genes by their direction of translation.

