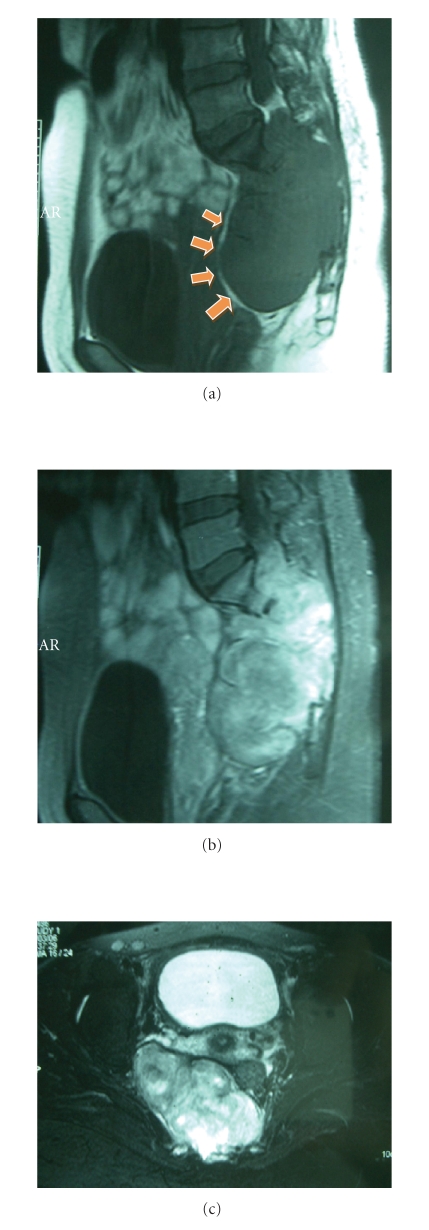
Figure 2.
MR examination of pelvis demonstrates bony destruction at sacrum and neural foramen from S1–S4 levels with soft tissue mass formation. This mass appears as low signal intensity on sagittal T1-weighted MR image (Figure 2(a)), heterogeneous increased signal intensity on sagittal and axial T2-weighted MR image (Figures 2(b) and 2(c)). Tumor extended and displaced uterus and urinary bladder anteriorly, but not invaded, evidenced by fat plane (arrows).

