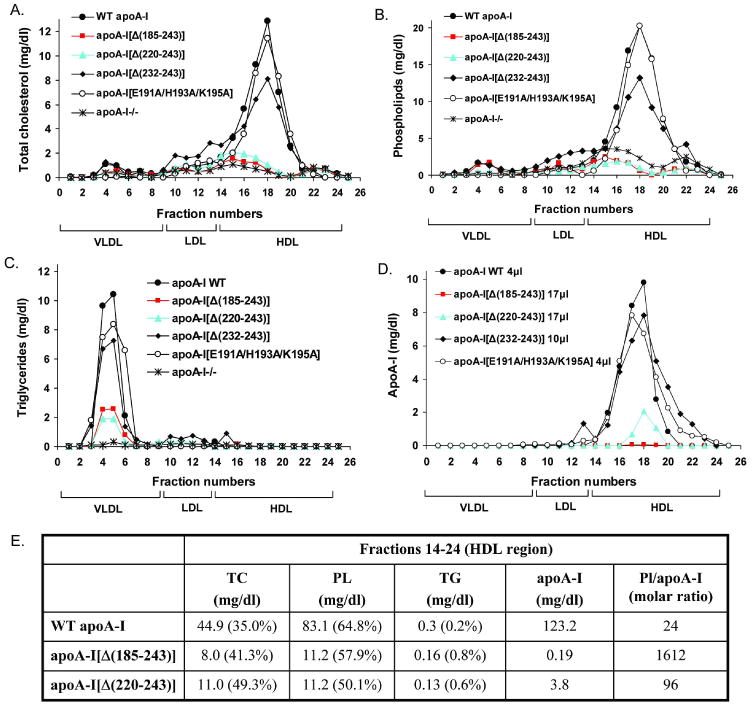
FIGURE 3. FPLC profiles of total cholesterol, phospholipids, triglycerides and apoA-I in plasma of apoA-I-/- mice expressing the WT apoA-I or the carboxy-terminal mutants apoA-I[Δ(185-243)], apoA-I[Δ(220-243)], apoA-I[Δ(232-243)], apoA-I[E191A/H193A/K195A] or the control protein GFP.

Plasma samples were obtained from mice infected with 1×10⁹ pfu of the recombinant adenoviruses expressing the WT or mutant forms of apoA-I or the control protein GFP four days post-infection. The samples were fractionated by FPLC and then the total cholesterol (A), phospholipids (B), triglycerides (C) and apoA-I (D) levels of each FPLC fraction were determined as described in Experimental Procedures. Panel E, Lipids and apoA-I concentrations from a pool of lipoprotein fractions that correspond to the HDL region (fractions 14-24) expressed as mg/dl. TG, triglycerides; PL, phospholipids; TC, total cholesterol; %, percentage composition relative to the sum of TG, PL and TC values. PL/apoA-I is expressed as molar ratio.
