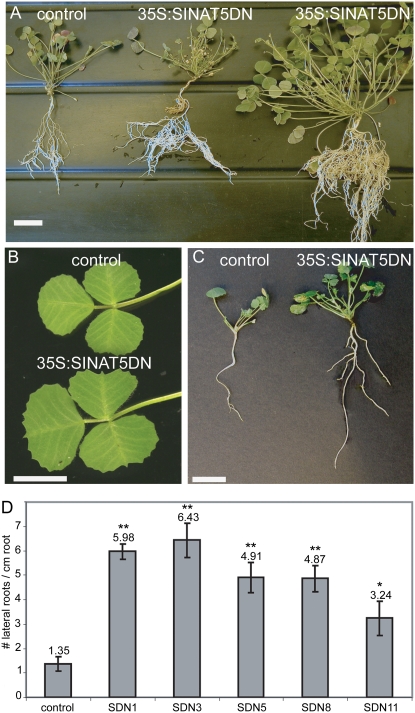
Figure 4.
M. truncatula 35S:SINAT5DN shoot and root phenotype. A, Eight-week-old T0 35S:SINAT5DN plants grown in rich soils, demonstrating vigorous growth and more roots compared to the T0 control plant. B, Trifoliate leaf of control and 35S:SINAT5DN T2 plants. C, LR phenotype of 35S:SINAT5DN and control plants after 20 d of in vitro growth. D, Average number of LRs/cm of 35S:SINAT5DN T1 M. truncatula lines (SDN1, SDN3, SDN5, SDN8, and SDN11) and control plants after 6 d of NAA treatment on 12-d-old plants. Error bars, se measurements. Significantly different values are labeled with a different number of asterisks as defined by a two-tailed t test (* = P < 0.05; ** <0.001 for the transgenic line compared to the control). Bars = 3 cm (A) and 1 cm (B and C).

