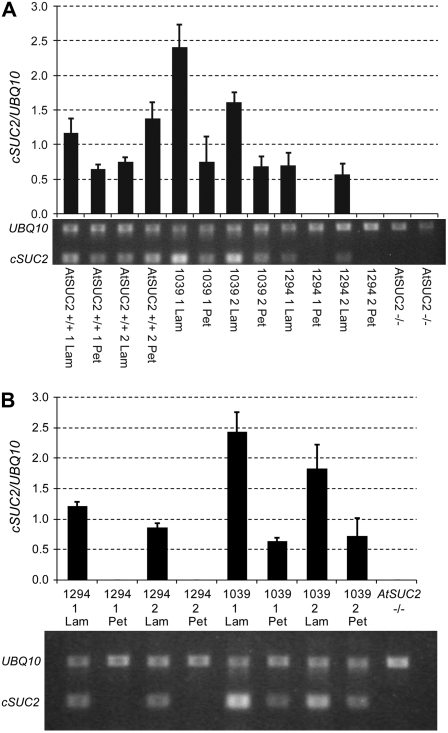
Figure 4.
Semiquantitative RT-PCR transcript analysis comparing AtSUC2 and cSUC2 expression levels in lamina samples that included the midrib (Lam) and petioles (Pet). A, AtSUC2 and cSUC2 transcript abundance relative to UBQ10 from two sibling plants (siblings marked 1 and 2) of AtSUC2 +/+, SUC2p∷cSUC2 (1039), CmGAS1p∷cSUC2 (1294), and AtSUC2 −/− plant (whole plant sample), as indicated, using primers AtSUC2Ex3Ex4F and SUC2-3-ORF. B, cSUC2 transcript abundance relative to UBQ10 from two sibling plants (siblings marked 1 and 2) of CmGAS1p∷cSUC2 (1294), SUC2p∷cSUC2 (1039), and one AtSUC2 −/− plant (whole plant sample), as indicated, using primers AtSUC2Ex3Ex4F and NospASacR. Average and sd values from three PCR replicates are represented in the graphs, and below each graph is a representative gel image.

