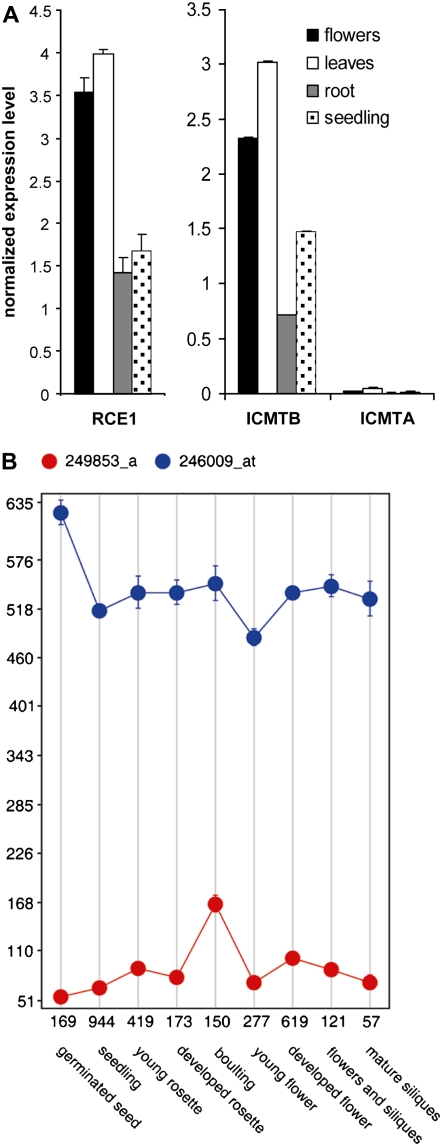
Figure 6.
Expression levels of AtICMTA and AtICMTB and AtRCE1. A, Q-PCR determined relative and normalized expression levels of AtRCE1, AtICMTA, and AtICMTB. ACTIN was use as internal control in the Q-PCR. Average was calculated using three replicates. The error bars represent sd. B, Microarray data taken from Genevestigator (Zimmermann et al., 2004; Laule et al., 2006) show the expression levels of AtICMTA (red) and AtICMTB (blue) during development of Arabidopsis.

