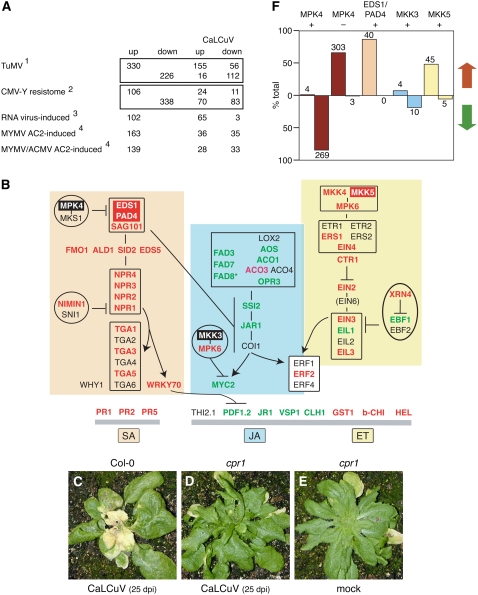
Figure 2.
Pathogen response during CaLCuV infection. Genes differentially expressed during CaLCuV infection were compared to the expression profiles of Arabidopsis genes that change in response to other plant pathogens or pathogen proteins. A, The comparisons include: (1) genes differentially expressed during the compatible TuMV infection (Yang et al., 2007); (2) genes differentially expressed during the resistance response to CMV-Y (Marathe et al., 2004); (3) transcripts elevated by five RNA viruses in planta (Whitham et al., 2003); and (4) transcripts increased in cultured cells expressing MYMV or ACMV AC2 protein (Trinks et al., 2005). The numbers of shared genes that are up- or down-regulated in CaLCuV-infected leaves are indicated for each comparison. The totals for each treatment were adjusted to include only genes represented on the ATH1 array. B, A model of the interactions between key genes involved in the SA (orange), JA (blue), and ET (yellow) pathogen response pathways. The genes are shown in their proposed order in the regulatory network or order of expression. Genes with elevated mRNA levels are in red typeface, while genes with reduced mRNA are in green typeface. The genes with red or black backgrounds are in F. The corresponding Arabidopsis gene numbers are in Supplemental Table S1. C, Infected Col-0 plant showing signs of senescence and cell death at 25 dpi is depicted. CaLCuV-inoculated cpr1 mutant (Bowling et al., 1994) at 25 dpi is shown in D, followed by a mock-inoculated cpr1 mutant at 25 dpi (E). Graph in F shows the percentage of overlap of mRNAs that are increased (red arrow) or decreased (green arrow) during CaLCuV infection to genes with reduced (MPK4 +) or elevated (MPK4 −) transcripts in an mpk4 mutant (Andreasson et al., 2005), with reduced RNA in an eds1/pad4 mutant (EDS1/PAD4 +; Bartsch et al., 2006), or with increased RNA in MKK3 (+)- or MKK5 (+)-overexpressing lines (Takahashi et al., 2007). The number of genes is indicated for each bar.

