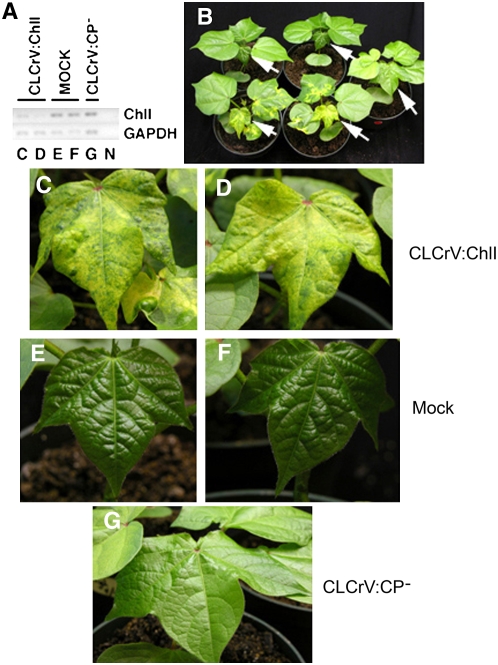
Figure 2.
Visual and molecular evidence of CLCrV-induced gene silencing. A, Semiquantitative RT-PCR showing down-regulation of the ChlI gene in silenced plants kept at 25°C/23°C for 29 d. The top and bottom sections show ChlI accumulation after 27 PCR cycles or expression of GAPDH (internal control) after 23 PCR cycles, respectively. Letter beneath each lane corresponds to the section showing the leaf used for RNA isolation, except N is the no-RT-PCR control. B, Plants oriented with the leaves used for RT-PCR facing front. Arrows show the leaf used for each RNA extraction. Top row: mock inoculated; bottom row: ChlI-silenced; and middle row: right, empty vector. C and D, CLCrV:ChlI-inoculated leaves. E and F, Mock-inoculated plants bombarded with the CLCrV B component, which does not replicate in the absence of the A component. G, Empty vector-inoculated plants bombarded with pJRTCLCrV.008 and the B component. Chlorophyll appears to be lighter than in E and F because the leaf is horizontal and reflects more light (see B for comparison).

