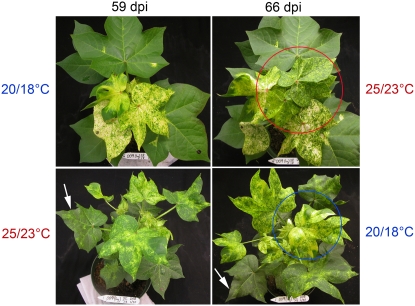
Figure 6.
Temperature rapidly changes the extent of gene silencing in new tissue. The same plant is shown in the top two or bottom two photos. Plants on the left were 59 dpi at 20°C/18°C (top left) or 25°C/23°C (bottom left). At 59 dpi, the plants were switched to new temperature regimes for 7 d (right). Leaves within the red circle show new growth at higher temperatures and have reduced chlorosis, the phenotype for ChlI silencing, while the new leaf at low temperatures has areas of increased, confluent silencing. The experiment used identical Percival chambers, except for temperature. Arrows on the bottom photos point to the same leaf for reference.

