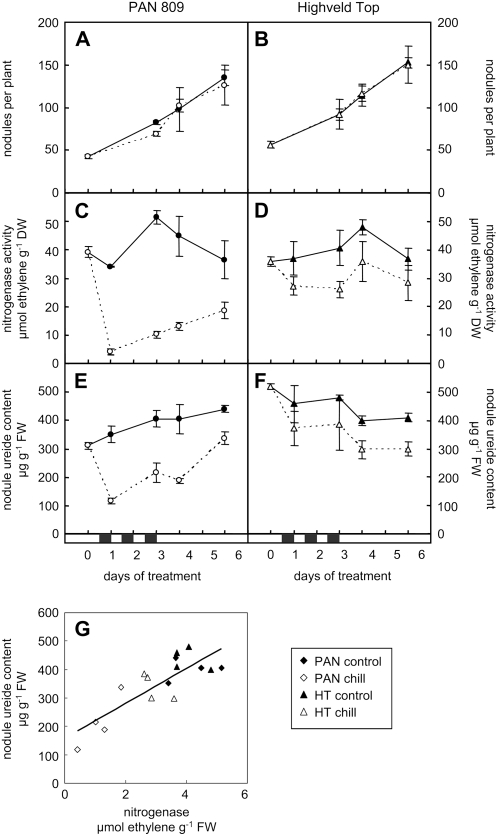
Figure 3.
A comparison of the effects of dark chilling on nodule numbers, nitrogenase activity, and nodule ureide content in PAN and HT (top) and the relationship between nodule ureide contents and nitrogenase activities (bottom). Nodules per plant (A and B), nitrogenase activity of whole root systems with attached nodules (C and D), and nodule ureide content (E and F) were determined in samples collected at midday (noon). The relationship between nodule ureide contents and nitrogenase activities is shown in G. DW, Dry weight; FW, fresh weight. The black horizontal bars above the x axis indicate the three consecutive nights of chilling. Black and white symbols represent control and dark chilled plants, respectively. Each data point represents the mean of three replicates ± se.

