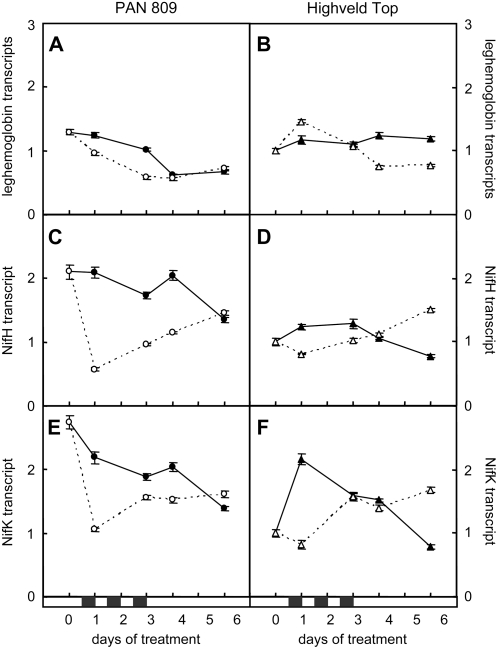
Figure 5.
A comparison of the effects of dark chilling on the abundance of transcripts encoding leghemoglobin, NifH, and NifK in PAN and HT. Data are expressed relative to values obtained in HT unchilled samples at the start of the experiment. Black and white symbols represent control and dark chilled plants, respectively. Each data point represents the mean of three replicates ± se.

