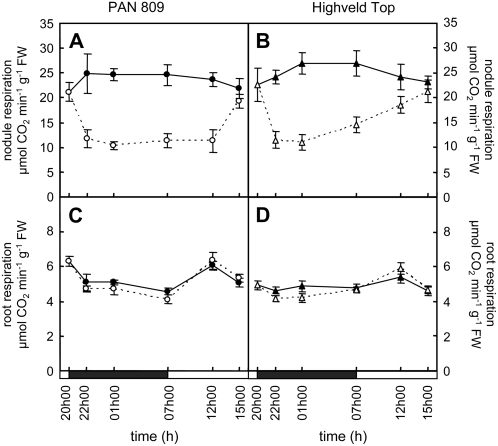
Figure 7.
A comparison of the effects of dark chilling on diurnal nodule and root respiration rates in PAN and HT. Respiration rates were measured in nodules (A and B) and roots (C and D) before the onset of dark chilling treatment (20h00), during dark chilling treatment (22h00, 01h00, and 07h00), and during the day following dark chilling (12h00 and 15h00). The black horizontal bars above the x axis indicate the dark chilling period. Black and white symbols represent control and dark chilled plants, respectively. Each data point represents the mean of six replicates ± se.

