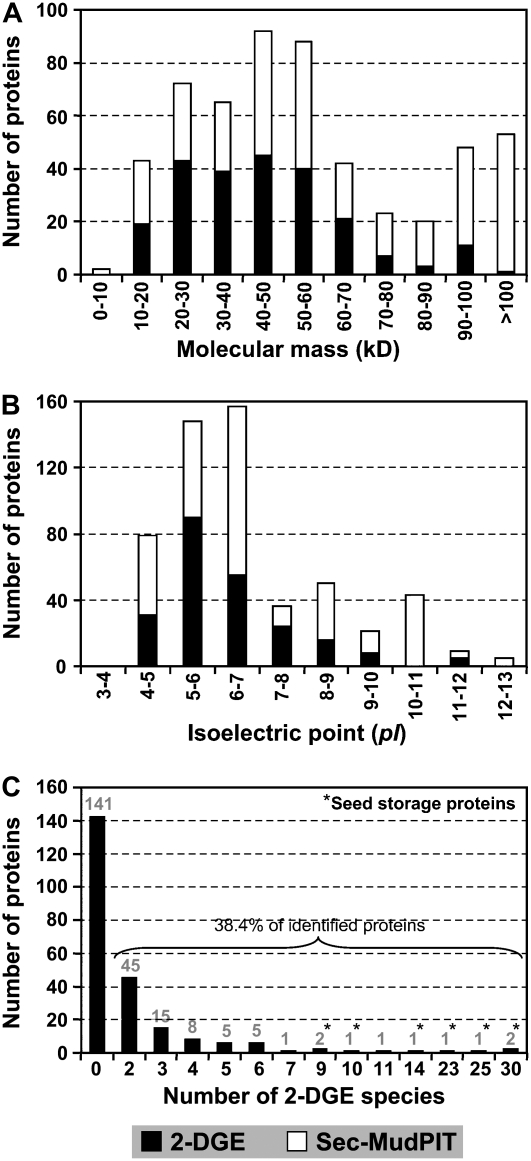
Figure 2.
Biochemical properties of soybean proteins expressed during seed development. Theoretical molecular masses and pIs of proteins identified by 2-DGE and Sec-MudPIT were used for comparative analysis. Results presented in A and B are based on NR proteins. A, Molecular mass distribution over 10-kD increments of proteins identified by 2-DGE and Sec-MudPIT. B, Distribution of proteins versus pI. C, Distribution of 2-DGES of proteins identified by 2-DGE. Total number of proteins possessing multiple 2-DGES is mentioned on the top of each bar. SSPs are marked by asterisks.

