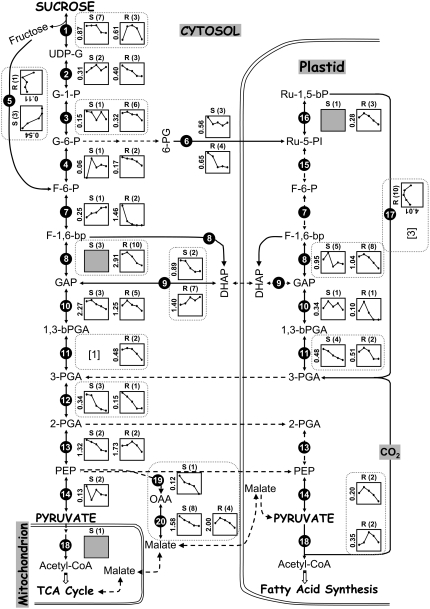
Figure 7.
Comparative proteomics view of carbon assimilatory and glycolytic pathways leading to fatty acid synthesis in soybean and rapeseed reveals apparent differences in enzyme abundance, number of 2-DGES, and expression trends. Composite expression profiles of identified enzymes in soybean (S) and rapeseed (R) are presented after normalization and subtraction of SSPs. The y-axis value is the total relative abundance of spot volume at the peak of expression. Each filled circle within the expression profile represents the developmental stage of seed filling starting at 2 WAF through 6 WAF. The total number of protein spots identified by nESI-LC-MS/MS (this study) and MALDI-TOF-MS (previous study; Hajduch et al., 2005) for a given enzyme is noted in parentheses. Absence of protein expression profiles for a given enzymatic step indicates no identification of that enzyme in either soybean or rapeseed by 2-DGE analysis. In this situation, Sec-MudPIT datasets were searched and the total number of identified enzymes is given in the bracket near each enzyme number for soybean. Shaded squares indicate that expression profiles were not obtained for those identified proteins due to either very low abundance or presence in less than three developmental stages. Broken arrows denote no identification of enzymes in soybean and rapeseed datasets. Broken boxes highlight abundance and expression profile differences between soybean and rapeseed. Abbreviations for metabolites are as defined in the text and as follows: UDP-G, uridine diphospho-Glc; G-1-P, Glc-1-P; G-6-P, Glc-6-P; 6-PG, 6-phospho-d-gluconate; F-6-P, Fru-6-P; F-1,6-bP, Fru-1,6-bisP; GAP, glyceraldehyde-3-P; DHAP, dihydroxyacetone phosphate; 1,3-bPGA, 1,3-bisphosphoglyceric acid (or 1,3-bisphosphoglycerate); PGA, phosphoglyceric acid; Ru-5-PI, ribulose-5-P; Ru-1,5-bP, ribulose-1,5-bisP.

