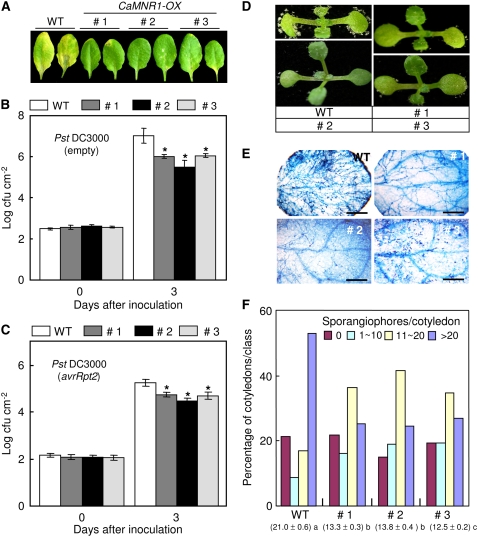
Figure 9.
Enhanced basal disease resistance of CaMNR1-OX transgenic Arabidopsis. A, Disease symptoms on the leaves of wild-type and transgenic Arabidopsis plants at 5 d after spray inoculation with Pst DC3000 (108 cfu mL−1). B and C, Bacterial growth in the leaves of wild-type and transgenic plants at 0 and 3 d after inoculation with a virulent (empty) strain (B) and an avirulent (avrRpt2) strain (C) of Pst DC3000 (5 × 10⁴ cfu mL−1). Data are means ± sd from three independent experiments. Asterisks indicate significant differences as determined by Student's t test (P < 0.05). D, Disease symptoms on the cotyledons of wild-type and transgenic Arabidopsis plants at 7 d after spray inoculation with H. parasitica isolate Noco2 (5 × 10⁴ spores mL−1). E, Trypan blue staining of cotyledons of wild-type and transgenic Arabidopsis plants at 7 d after inoculation with H. parasitica isolate Noco2. Bars = 200 μm. F, Numbers of sporangiophores per cotyledon of wild-type and transgenic plants at 7 d after inoculation with H. parasitica. Cotyledons were classified as follows: no sporulation (no sporangiophores per cotyledon), light sporulation (approximately 1–10 sporangiophores per cotyledon), medium sporulation (approximately 11–20 sporangiophores per cotyledon), or heavy sporulation (more than 20 sporangiophores per cotyledon). Sporangiophores were counted on more than 50 cotyledons per genotype. Average numbers of sporangiophores produced on the cotyledons of wild-type and transgenic lines are shown at bottom for each of the lines tested. Statistically significant differences between means were determined employing the lsd (P = 0.05).

