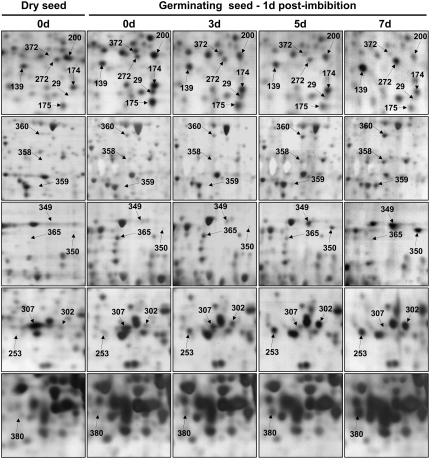
Figure 5.
Changes in protein accumulation patterns in deteriorated seeds during germination sensu stricto (1 d after imbibition). An equal amount (150 μg) of total soluble protein extracts was loaded on each gel. Proteins were separated by 2D gel electrophoresis. A representative silver-stained 2D gel of total soluble proteins from nondeteriorated dry mature seeds is presented in Figure 2A. The analysis was carried out on nondeteriorated seed samples (0 d, control seeds) and deteriorated seeds (3, 5, and 7 d of CDT) imbibed in water for 1 d. The 17 labeled protein spots (spots 29, 139, 174, 175, 176, 200, 253, 272, 302, 349, 350, 358, 359, 360, 365, 372, and 380) were identified by mass spectrometry and by comparison with Arabidopsis seed protein reference maps (Gallardo et al., 2001, 2002a; Rajjou et al., 2004, 2006a; Job et al., 2005; http://www.seed-proteome.com; Tables IV and V; Supplemental Table S2). Protein spot quantitation was carried out as described in “Materials and Methods” from at least five gels for each seed sample.

