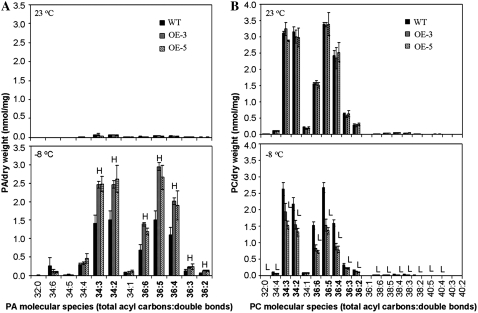
Figure 6.
Freezing-induced changes in PA and PC species of Arabidopsis wild type (WT) and ACBP6 overexpressors (OE-3 and OE-5) before and after CA followed by freezing treatment. The black bar represents the wild type, and the hatched bars represent OE-3 and OE-5 (as indicated). Numbers in boldface indicate species with increases in PA that have corresponding decreases in PC. H, Value higher than the wild type (P < 0.05); L, value lower than the wild type (P < 0.05). Values are means ± sd (n = 3).

