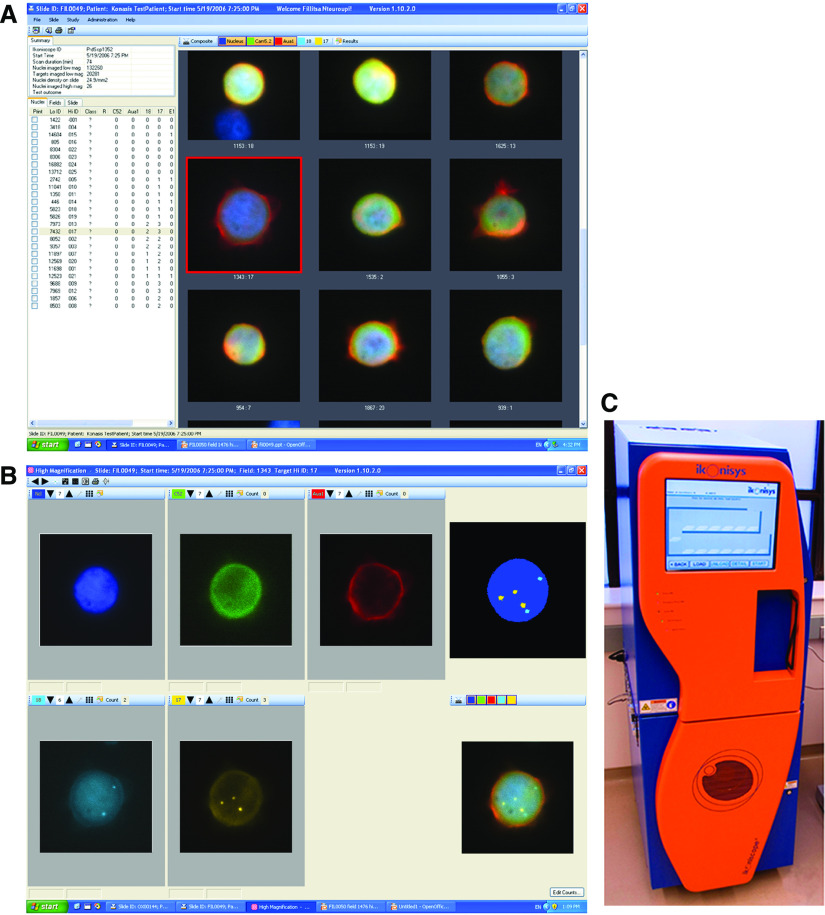
Figure 1.
Screen captures of the Viewer software that displays the data produced by the Ikoniscope® scanning system (C). C32 cells were spiked in normal blood, isolated by LymphoprepTM and immunostained with AUA1 and Cam5.2 followed by FISH with CEP probes for chromosomes 17 and 18. (A): High magnification ( × 100) target gallery screen showing composite images of C32 cells for AUA1 (Cy5), Cam5.2 (green) and nuclei (DAPI/blue) staining. (B): Screenshot displaying a target C32 cell at high magnification. Pseudo colored images in the DAPI (nucleus), green (Cam5.2), Cy5 (AUA1), orange (CEP 17) and aqua (CEP 18) channels are shown on the left side of the screen shot (clockwise from top left corner). A composite image of all five channels is shown at the bottom right of the screen shot. After automatic identification of FISH signals, a pseudo colored composite image of the nucleus, in which chromosomes 17 appear in yellow and chromosomes 18 appear in aqua, is shown at the top right of the screenshot.

