Figure 3.
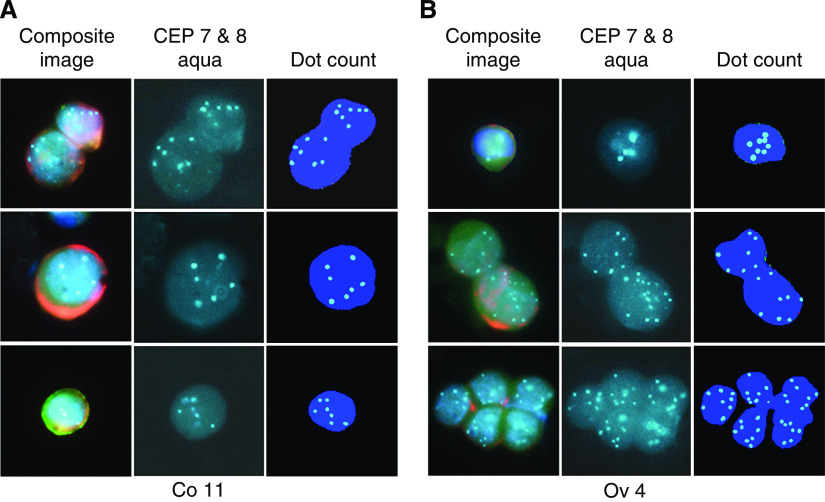
Circulating tumour cells isolated by filtration from the peripheral blood of colorectal and ovarian cancer patients. Composite pseudo colored images of cells at high magnification ( × 100) in the DAPI, green, Cy5 and aqua channels are shown on the left of each panel, followed by cell images in the aqua channel in the middle of each panel. After automatic identification of FISH signals (dot count), a pseudo colored composite image of the nucleus, in which chromosomes 7 and 8 appear in aqua, is shown on the right of each panel. (A) CTCs were isolated from colorectal cancer patient Co 11 and were immunostained with AUA1 (green) and Cam5.2 (Cy5), followed by FISH with CEP 7/aqua and CEP 8/aqua. A total of 7 aqua dots are present in each nucleus, indicating polysomy for at least one of the chromosomes 7 and 8. (B) CTCs were isolated from ovarian cancer patient Ov 4 and were immunostained with AUA1 (green) and Cam5.2 (Cy5), followed by FISH with CEP 7/aqua and CEP 8/aqua. A total of 8 aqua dots are present in each nucleus, indicating polysomy for at least one of the chromosomes 7 and 8.

