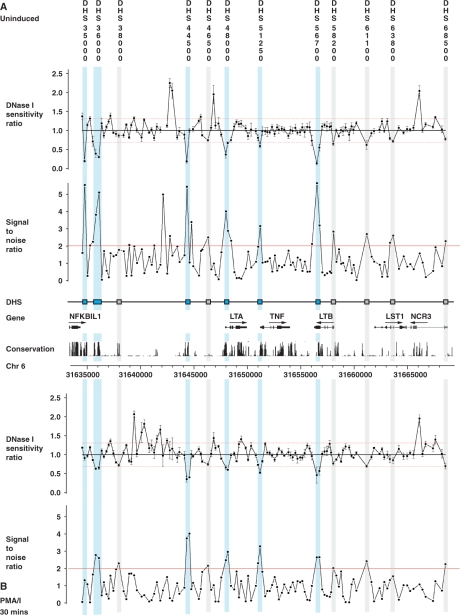
Figure 1.
Quantitative chromatin profiling for a 34 kb region spanning the TNF locus and flanking genes in GM12156. This was carried out for four replicate DNase I digestions to give DNase I sensitivity measurements (ratios of copy number in treated compared to untreated samples) from 140 contiguous PCR amplicons designed to tile across the region (31634558–31668876). All samples were quantified in triplicate by Q-PCR. Relative DNase I sensitivity measurements are shown (DNase I-treated versus untreated) together with SNRs with genomic coordinates given along the x-axis. GM12156 was used, either resting (panel A) or after induction with 125 nM ionomycin plus 200 nM PMA for 30 min (panel B). Analysis revealed strong evidence for six hypersensitive sites (highlighted in light blue on figure): ‘DHS 35000’ 0.3 kb 3′ to exon 4 of NFKBIL1 in unstimulated cells (PCR amplicon coordinates 31634776–31635055); ‘DHS 36000’ 1.7 kb and 1.5 kb 3′ to exon 4 of NFKBIL1 in unstimulated cells (31636120–31636410) and stimulated cells (31635824–31636410) respectively; ‘DHS 44500’ 3.4 kb 5′ to LTA in unstimulated cells (31644348–31644622) and stimulated cells (31644348–31644807); ‘DHS 48000’ within 0.1 kb of the LTA transcriptional start site in unstimulated cells (31648007–31648254) extending up to 0.3 kb downstream in stimulated cells (31648007–31648393); ‘DHS 51250’ within 0.1 kb of the TNF transcriptional start site in stimulated cells (31651222–31651465) which was also present in unstimulated cells but to a lesser extent; ‘DHS 56700’ in exon 4 of LTB in unstimulated cells (31656528–31656800) and exon 4 and intron 3 of LTB in stimulated cells (31656528–31657053). In addition, six further sites are suggested with marginal evidence (shown highlighted in grey on figure).

