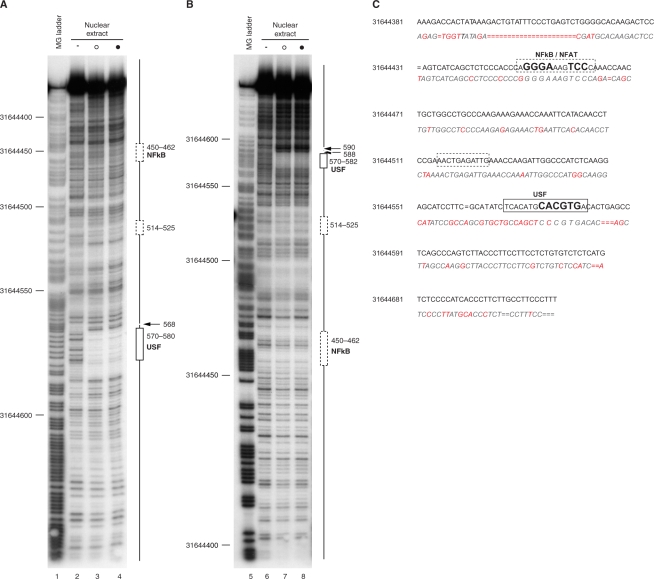
Figure 7.
DNase I footprinting analysis of DHS 44500. DNA probes spanning DHS 44500 radiolabelled on either the forward (panel A) or reverse (panel B) strands were digested with DNase I either alone or in the presence of NEs from Jurkat T cells. Maxam Gilbert sequencing ladder (lanes 1 and 5); naked DNA (0.0075 U DNase I) (lanes 2 and 6); NEs from unstimulated cells (0.25 U DNase I) (open circle) (lanes 3 and 7) or cells induced with PMA and ionomycin for 2 h (0.25 U DNase I) (filled circle) (lanes 4 and 8). (C) Schematic showing sites of protection in context of human and murine sequences.

