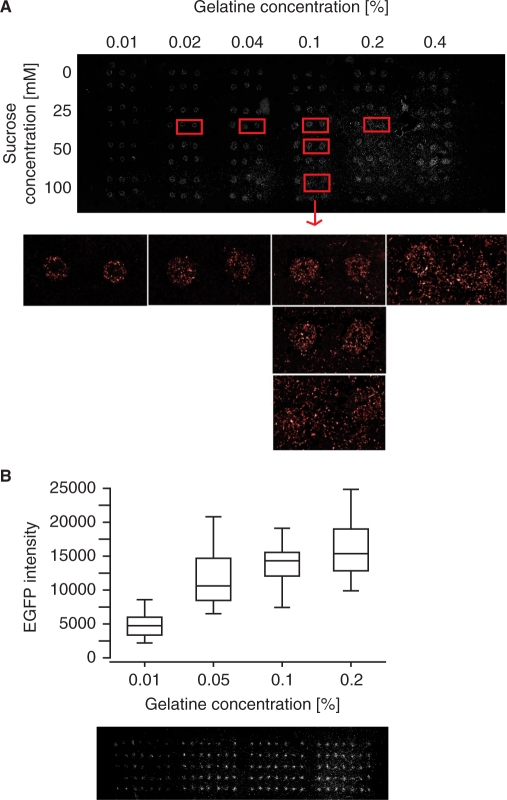
Figure 1.
Effects of sucrose and gelatine concentrations on spot integrity and transfection efficiency. (A) Array printed with pDsRed (50 ng/µl) in a printing solution with different gelatine and sucrose concentrations. Scanning image of the whole array and magnifications of specific spots. (B) Array printed with pEGFP (50 ng/µl) in a printing solution with 25 mM sucrose and four different concentrations of gelatine. Top: Box plot of the fluorescence intensities in each spot (n = 32–34). Bottom: Scanning image showing squares of seven times five spots for the four gelatine concentrations. From left to right: 0.01, 0.05, 0.1 and 0.2% gelatine. The DNA-lipid-gelatine-sucrose solutions were printed manually with a 10 µl pipette tip (A) or by MicroCasterTM manual arrayer system (B).

