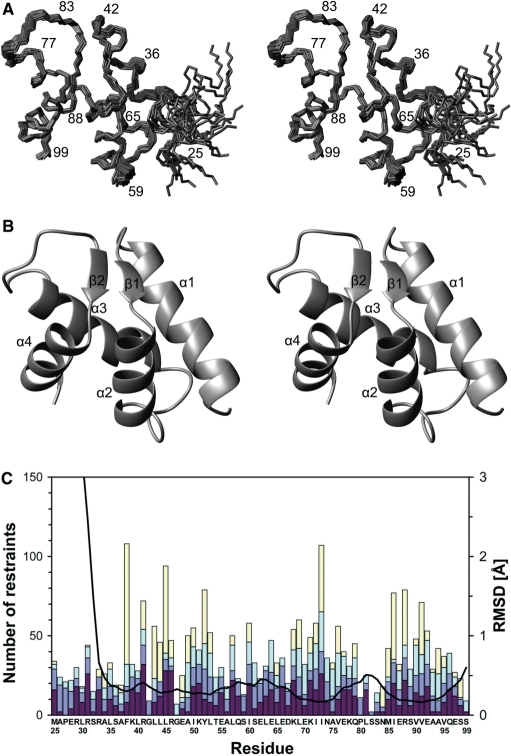
Figure 3.
The NMR structure and structural statistics of the amino-terminal domain of the human Pol ε B subunit. (A) Stereo view of backbone traces over residues 25–99 of the final ensemble of 20 models with the lowest NOE restraint violation energies. The program MOLMOL (34) was used to prepare the figure. (B) Ribbon presentation over residues 25–99, showing orientation of secondary structure elements. (C) NMR restraints and RMSD broken down by residues 25–99 of the construct. Colored bars indicate numbers of NOE restraints, Intraresidue NOEs, interresidue sequential NOEs (|i − j|=1), interresidue medium-range NOEs (1 < |i − j| < 5) and interresidue long-range NOEs (|i − j| ≥ 5), in dark red, blue, light blue and yellow, respectively from bottom to top. The black curve indicates local backbone heavy atom RMSDs. The program MOLMOL (34) was used to calculate RMSDs after superimposition of the structures over residues 32–99.

