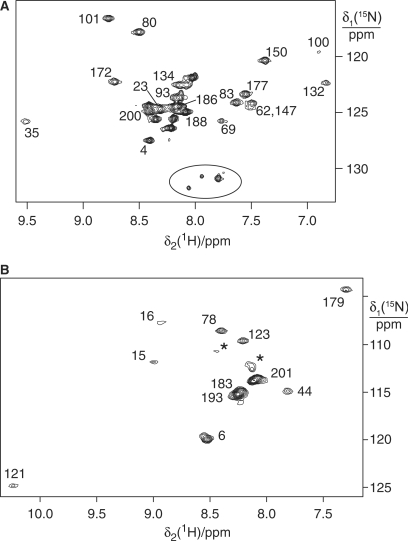
Figure 3.
15N-HSQC NMR spectra of ɛ in complex with θ. The cross-peaks are assigned with the residue numbers. (A) 15N-Ala labeled ɛ in complex with unlabeled θ. The circle identifies a set of unassigned peaks indicative of sample heterogeneity. They were not observed for the α:ɛ:θcomplex (Figure 5A, spectral region not shown). (B) 15N-Thr labeled ɛ in complex with unlabeled θ. The asterisks label peaks which were not observed in the spectra of ɛ186 or the α:ɛ:θ complex, indicating sample heterogeneity.

