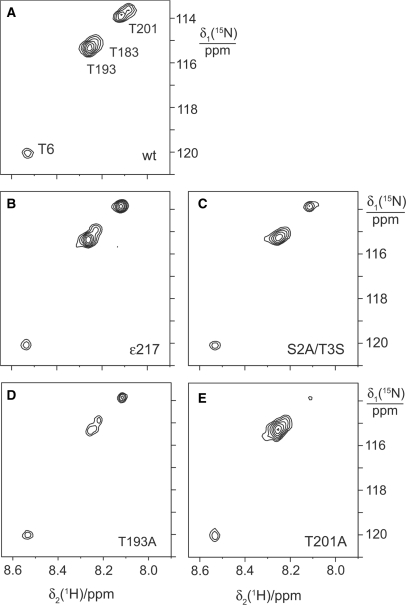
Figure 4.
15N-HSQC NMR spectra of α:ɛ:θ and mutant ɛ:θ complexes containing 15N-threonine labeled ɛ. For best comparison, the spectra were Fourier transformed with the same parameters and scaled for similar intensity of the cross-peak of Thr6 in all spectra. (A) Spectrum of the α:ɛ:θ complex. (B–E) Spectra of samples of the ɛ:θ complex prepared with mutant 15N-threonine labeled ɛ. The mutations are indicated.

