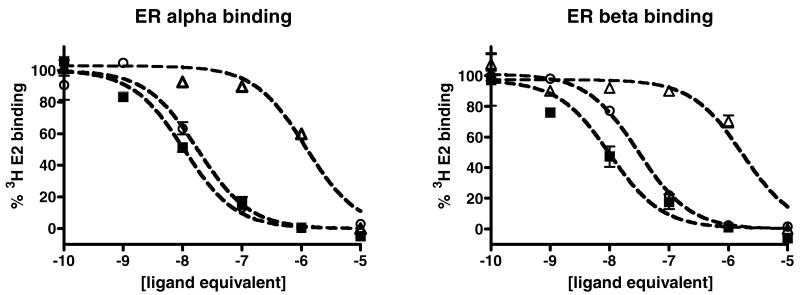
Figure 2.
Binding of compound 3 (black squares), conjugate 5 (open circles) and control conjugate 7 (open triangles) to ER alpha (left) and ER beta (right) as measured using a radiolabled ligand competition binding assay. The lines represent the best fit to a one binding site competition model using non-linear regression analysis.

