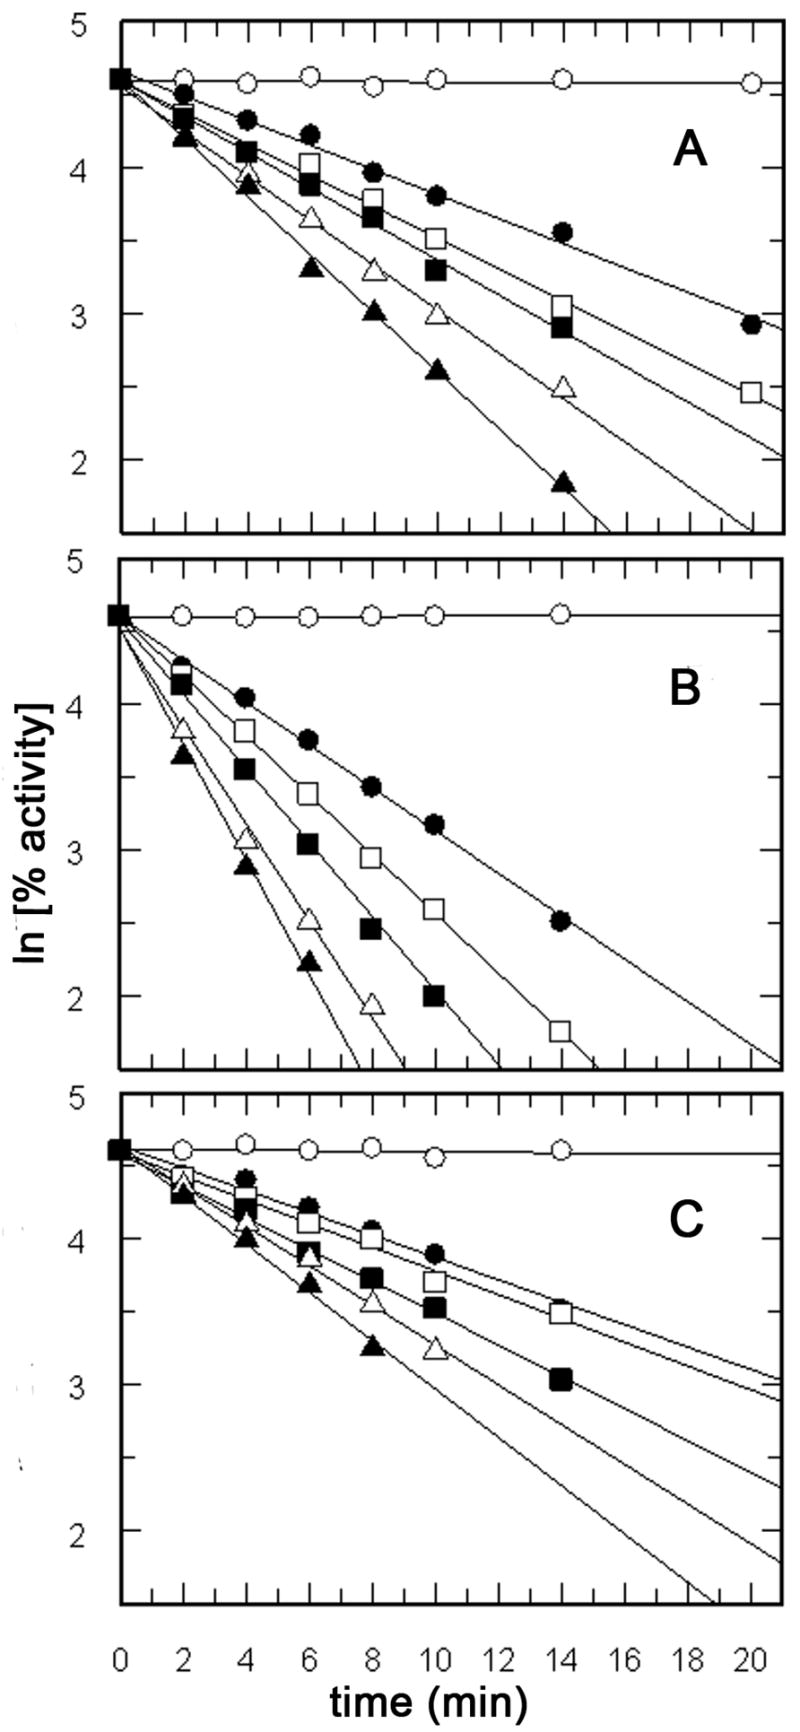
Figure 1.

Plots of ln [% inactivation] versus time for incubation of IPP isomerase with E-2-OPP, Z-2-OPP, and 4-OPP. Panel A, [E-2-OPP] = 0 (_), 0.4 (_), 0.5 (_), 0.7 (_), 1.0 (Δ), and 2.5 (_) μM. Panel B, [Z-2-OPP] = 0 (_), 15 (_), 20 (_), 30 (_), 40 (Δ), and 50 (_) μM. Panel C, [4-OPP] = 0 (_), 10 (_), 12 (_), 15 (_), 20 (Δ), and 25 (_) μM.
