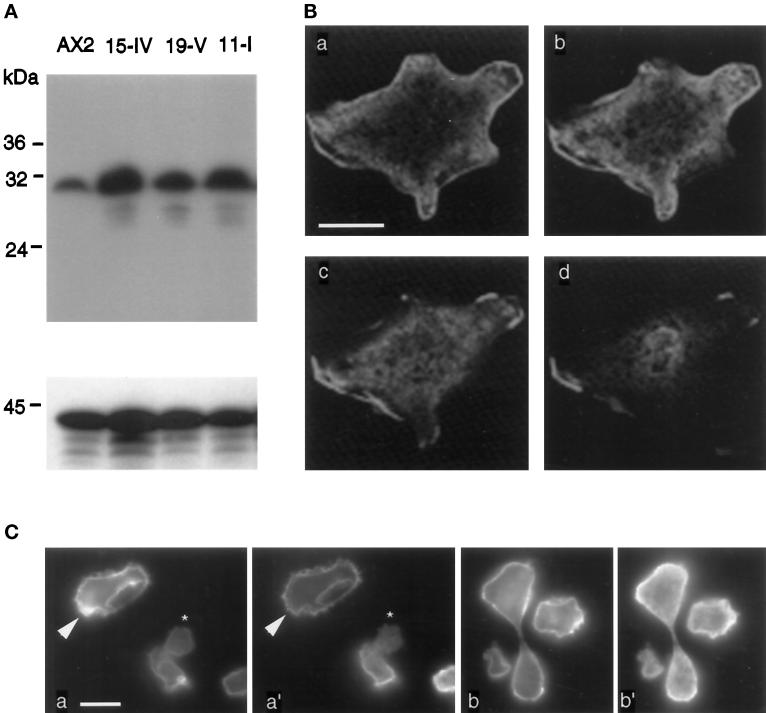
Figure 7.
(A) Western blot analysis of wild-type AX2 cells and three independent isolated DdLim-overproducing cells. Equal number of cells were loaded on each lane. Expression levels of DdLim were monitored using anti-DdLim antibodies (upper panel). Equal loading and transfer to nitrocellulose are confirmed by staining with an anti-actin antibody (lower panel). (B) Immunolocalization of DdLim in overexpressing cells using confocal fluorescence microscope. Vegetative cells were fixed with picric acid and paraformaldehyde and labeled as described for Figure 5B. Sections of a cell overproducing DdLim are shown from the substrate contact area (a) to the top of the cell (d). The distance between these sections is 0.5 μm. Scale bar, 10 μm. (C) Double labeling of DdLim-overproducing cells with rhodamine-phalloidin (a and b), anti-DdLim as first antibody, and fluorescein-conjugated antirabbit as the second antibody (a′ and b′).

