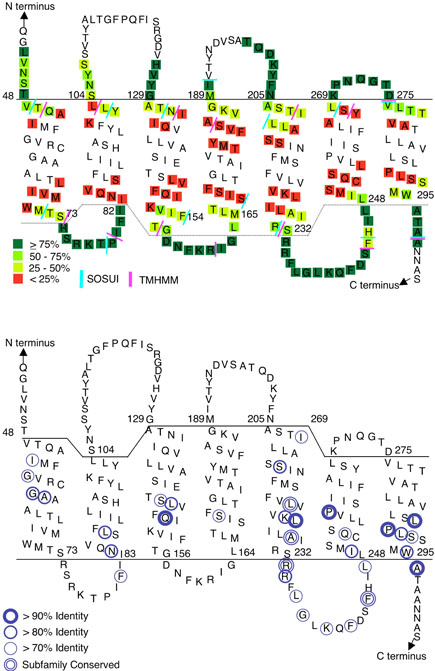
Figure 8. Summary of accessible residues and comparison with positions of conserved residues in Ste2.
(A) Reactivity of Cys-substituted residues in the intracellular regions of Ste2 is color-coded based on data from Figures 4-7. Accessibility data for the extracellular regions is summarized from previous studies (13, 14). The TMD boundaries were placed at the start of the drop in reactivity to MTSEA-biotin, as described in the text. The colored bars represent the ends of the TMDs predicted by the TMHMM and SOSUI computer algorithms (40) that were accessed at the ExPASy molecular biology server (http://ca.expasy.org/).
(B) Circles identify residues with the indicated percent identity across 28 different members of the Ste2 family of fungal pheromone receptors (5). Subfamily conserved residues show a high degree of identify within the budding yeast and filamentous fungi subfamilies, but are not identical between the two subfamilies.

