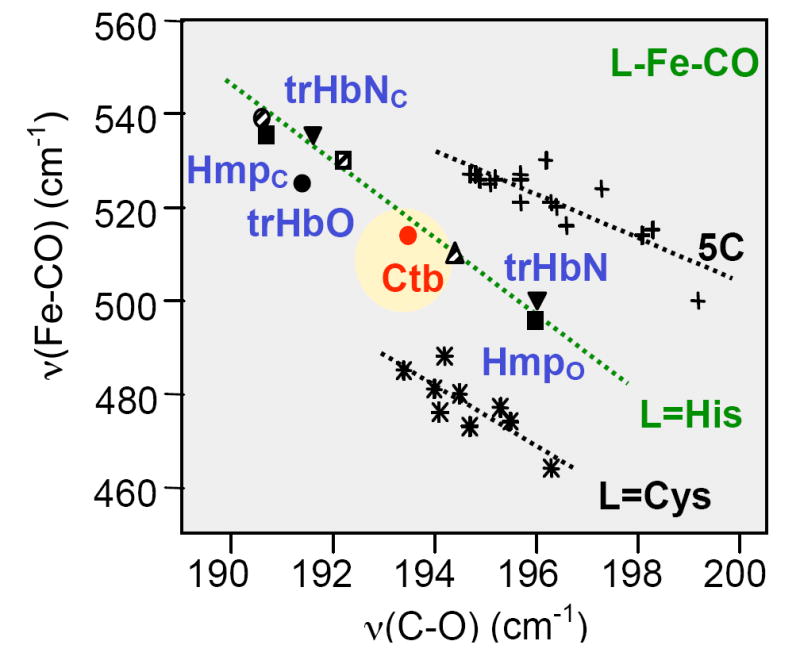
FIGURE 6.

Inverse correlation diagram of the Fe-CO stretching frequency versus the C-O stretching frequency of various heme proteins, and comparison with Ctb. The solid inverted triangles represent trHbN in closed (trHbNc, upper) and open (trHbNo, lower) conformations. Nearby, the solid squares represent Hmp in closed and open conformations. TrHbO is represented by the red, solid circle in the top left portion of the plot, and Ctb by the circle in the centre of the L=His line. The striped circle (extreme top left), striped square and striped triangle (middle) represent horseradish peroxidase, cytochrome c peroxidase and Mb, respectively. The L=Cys line corresponds to those proteins where the proximal ligand to the heme is the thiolate side chain of cysteine, the L=His line corresponds to those proteins where the proximal ligand is the imidazole/imidazolate side chain of histidine, and the 5C line corresponds to those proteins where the CO-bound form is penta-coordinate.
