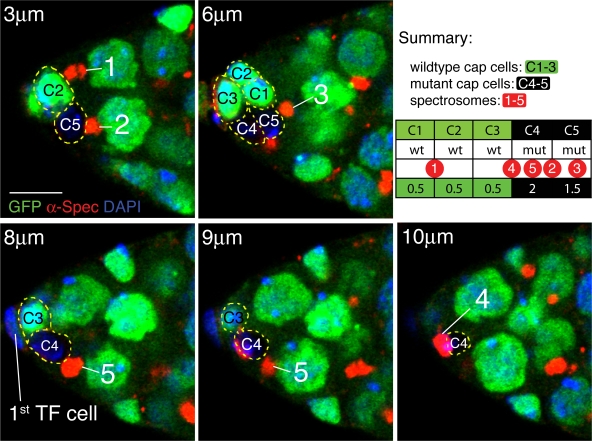
Figure 5.
RanBPM mutant CpCs are attached to more stem cell spectrosomes than normal. Five optical sections from a single RanBPMnull mosaic niche are shown. Antibodies to α-spectrin (red) mark the spectrosome of individual GSCs and cell membranes. In this example, the CpC cluster, which is composed of five CpCs (C1–5), is directly apposed to five spectrosomes (1–5). The spectrosome numbers also indicate the positions of the GSC nuclei. Two RanBPM mutant CpCs are marked by lack of nuclear GFP expression (C4 and C5). By studying the original optical stack, the attachment of each spectrosome to each CpC was noted (summary), and individual slices were chosen to best show the spectrosomes. Each panel is labeled with a distance in micrometers from the top of the optical stack as determined by LSM510 software. In this example, four of the five spectrosomes contact the two mutant CpCs. The number of spectrosomes per CpC is noted at the bottom of the summary table. When a spectrosome appeared to contact two CpCs, a score of 0.5 was given to each CpC. In this example, the mean number of spectrosomes per wild-type CpC is 0.5, whereas the mean for RanBPMnull CpCs is 1.75. Bar, 5 μm.

