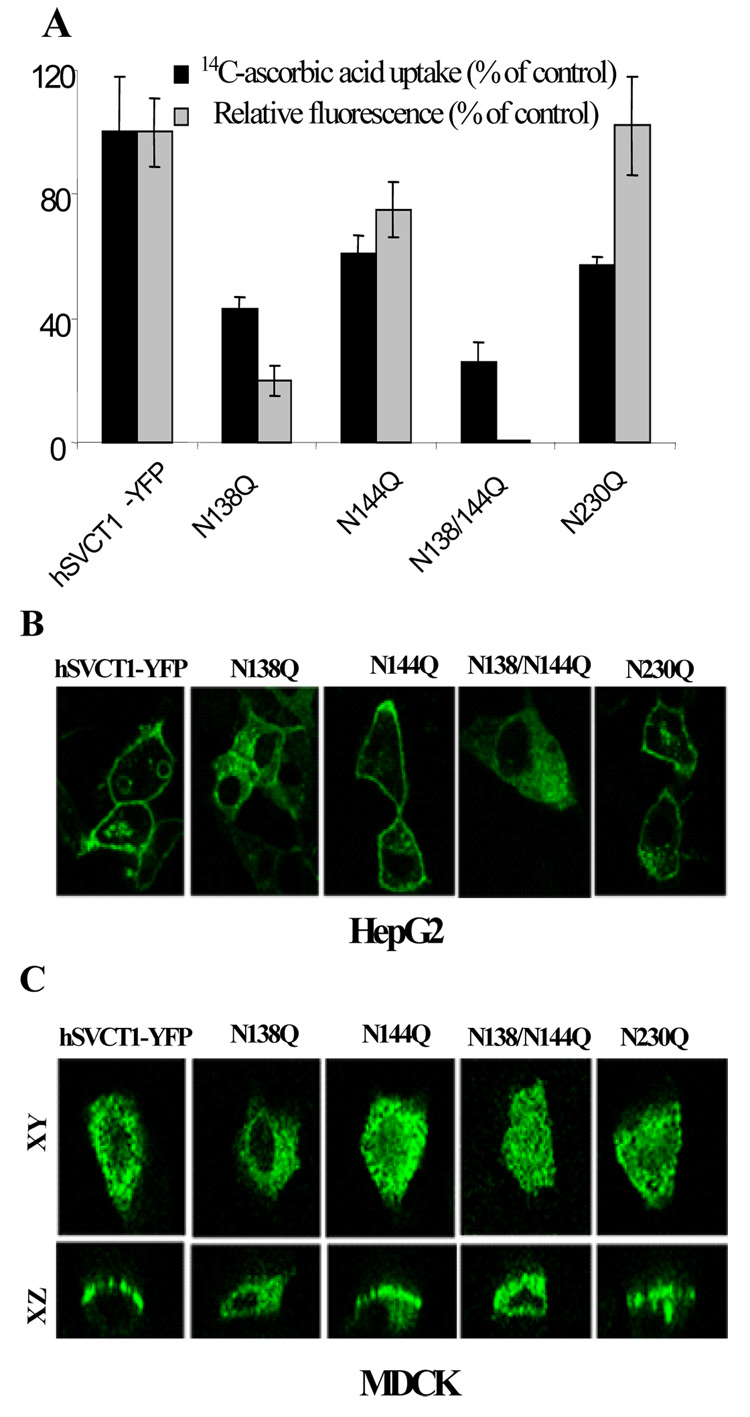
Fig. 3. Properties of hSVCT1 glycosylation mutants.
A, measurements of [14C]-ascorbic acid uptake and flow cytometric analysis of the mean fluorescence intensity of stable HepG2 cells expressing indicated constructs. B, lateral confocal images of the hSVCT1 glycosylation mutants in stable HepG2 cells. C, lateral (xy; top) and axial (xz; bottom) images captured 24–48 hrs after transient transfection of constructs into MDCK cells.

