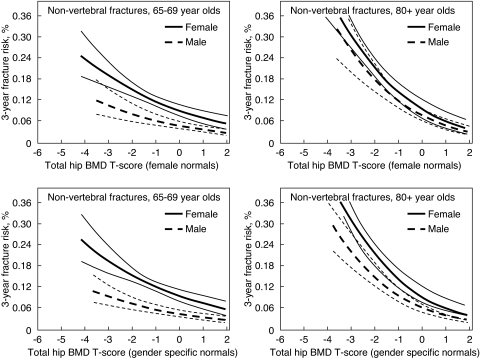
Figure 11.
Three-year risk of fracture (and 95% confidence limits) by sex-specific total hip BMD T-score and age in older women and men. T-scores for males using male normal values for the total hip are equivalent to the following BMD values: T-score of −2 = 0.753 g/cm2; T-score of −1 = 0.897 g/cm2; T-score of 0 = 1.041 g/cm2. T-scores for females using female normal values for the total hip are equivalent to the following BMD values: T-score of −2 = 0.698 g/cm2; T-score of −1 = 0.820 g/cm2; T-score of 0 = 0.942 g/cm2. T-scores for both sexes using female normal values for the total hip are equivalent to the following BMD values: T-score of −2 = 0.698 g/cm2; T-score of −1 = 0.820 g/cm2; T-score of 0 = 0.942 g/cm2. [Reproduced from S. R. Cummings et al.: J Bone Miner Res 21:1550–1556, 2006 (202), with permission of the American Society for Bone and Mineral Research.]

