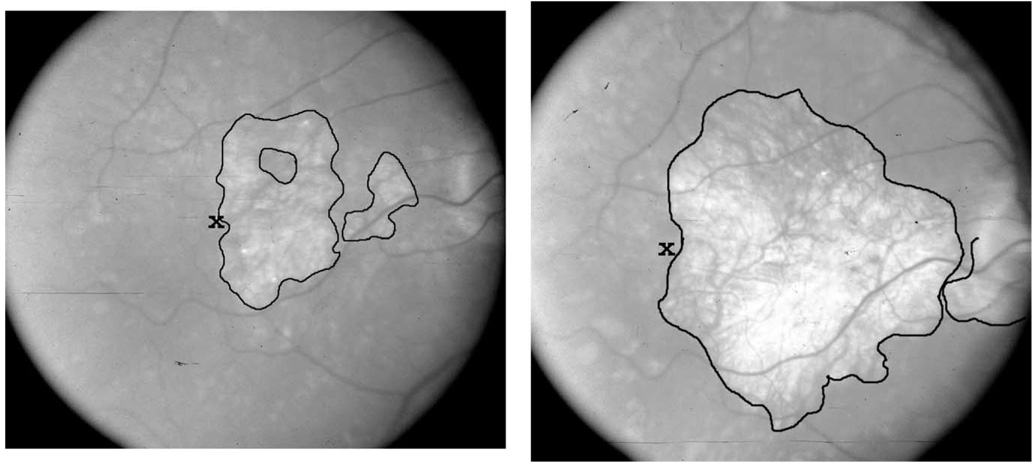
Figure 1.
Progression of geographic atrophy (GA) with a stable fixation pattern. (Left) At baseline, fixation (x) was placed with the atrophy and its corresponding scotoma to the right (circled white areas; there is a nonfoveal spared region within the larger area of GA, which is not used for fixation). At this time, visual acuity was 20/112, and the total area of GA was 3.3 Macular Photocoagulation Study (MPS) disc areas. (Right) Five years later, the GA has enlarged significantly, now measuring 10.3 MPS disc areas. Fixation remains positioned with the atrophy and its corresponding scotoma to the right. At this time, visual acuity was 20/235.

