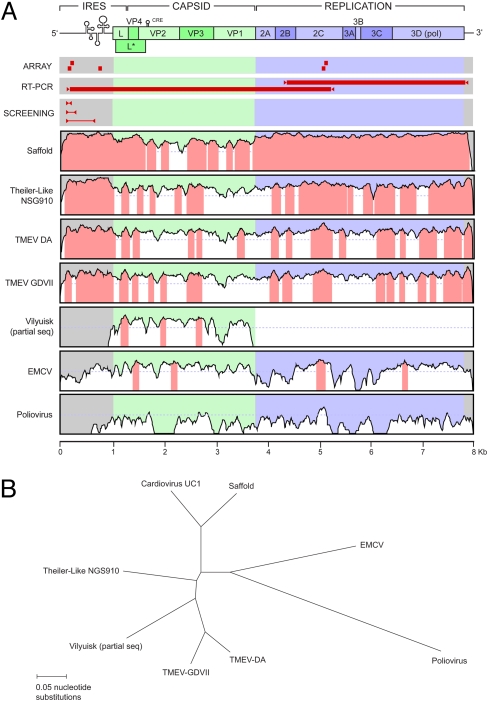
Fig. 1.
Genome sequence of UC1. (A) Genome sequence similarity plots compare UC1 with Saffold virus, Theiler-Like NGS910 virus, TMEV-DA, TMEV-GDVII, Vilyuisk virus (partial sequence only), EMCV, and poliovirus. The y axis scale for each plot represents percentage of nucleotide identities from 0% to 100%. Regions of the genome with percentage of nucleotide identities of >70% are highlighted in pink. The Virochip oligonucleotides used to detect UC1 (“ARRAY”), the fragments generated by long-range RT-PCR and used to sequence most of the virus (“RT-PCR”), and the cardiovirus primers and resulting PCR fragments used for screening of stool, CSF, and respiratory secretions (“SCREENING”) are also shown mapped onto the UC1 genome. The sequences of these primers are provided in Table S1. (B) Radial tree depicts the phylogenetic relationships between the genomes of UC1 and the seven aforementioned cardioviruses.

